Bitcoin / US Dollar
Price Analysis
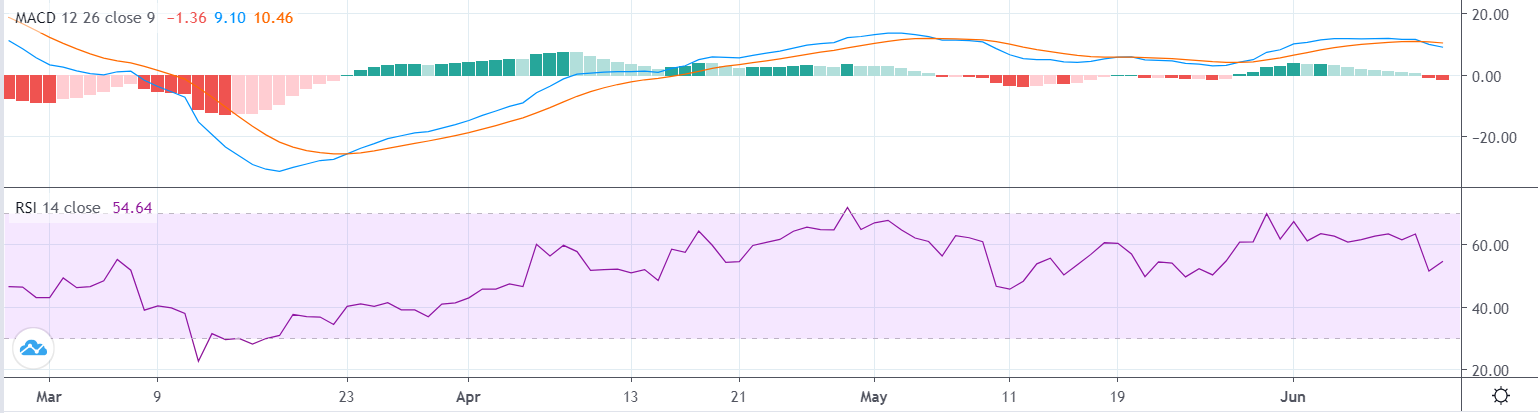
As expected, the symmetric triangle broke and the price dropped at $9,400 during the day. The previous uptrend was formed through a bending curve. The bending curve shows that there is a definite lack of momentum of the market and Bitcoin's dynamic gets weaker over the last week. The lack of momentum could not power Bitcoin's price to break the $10,000 resistance, a crucial point for Bitcoin's price.
The symmetric triangle and the bending curve were two bearish signals that indicate a reverse in the current trend. After the initial losses, we will see if there is more downtrend to follow or there would be another reverse on it. The most important part, in this case, seems to be the volume as many investors liquidate their positions, leading to yesterday's drop.
An interesting feature between the two parallel channels is that there is an internal support level at $9,400, which did not break at this time. This is a hopeful insight that could help us examine the move between the parallel channels during this period. Any move from now on, there should be around this time.
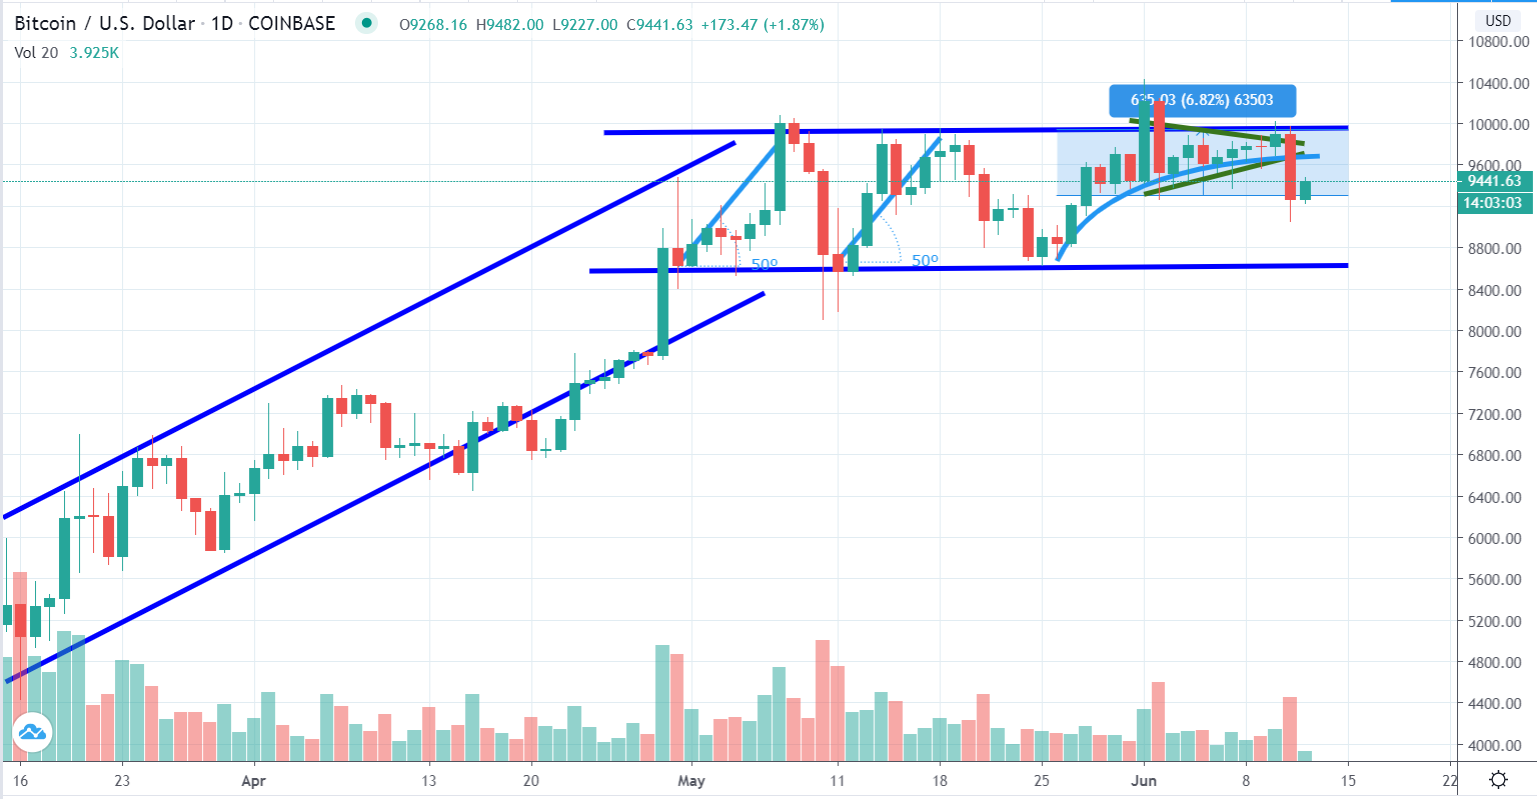
In the short-term diagram, it's far more evident that the parallel channels have emerged as the frontiers of Bitcoin's price, reducing by far the volatility during last. The volatility reduction could remove doubts from the investor's perspective who are risk-averse and want more stable investing solutions in their portfolio. At this point, we should highlight that cryptocurrencies could serve as the riskiest investments in an average portfolio.
Indicators
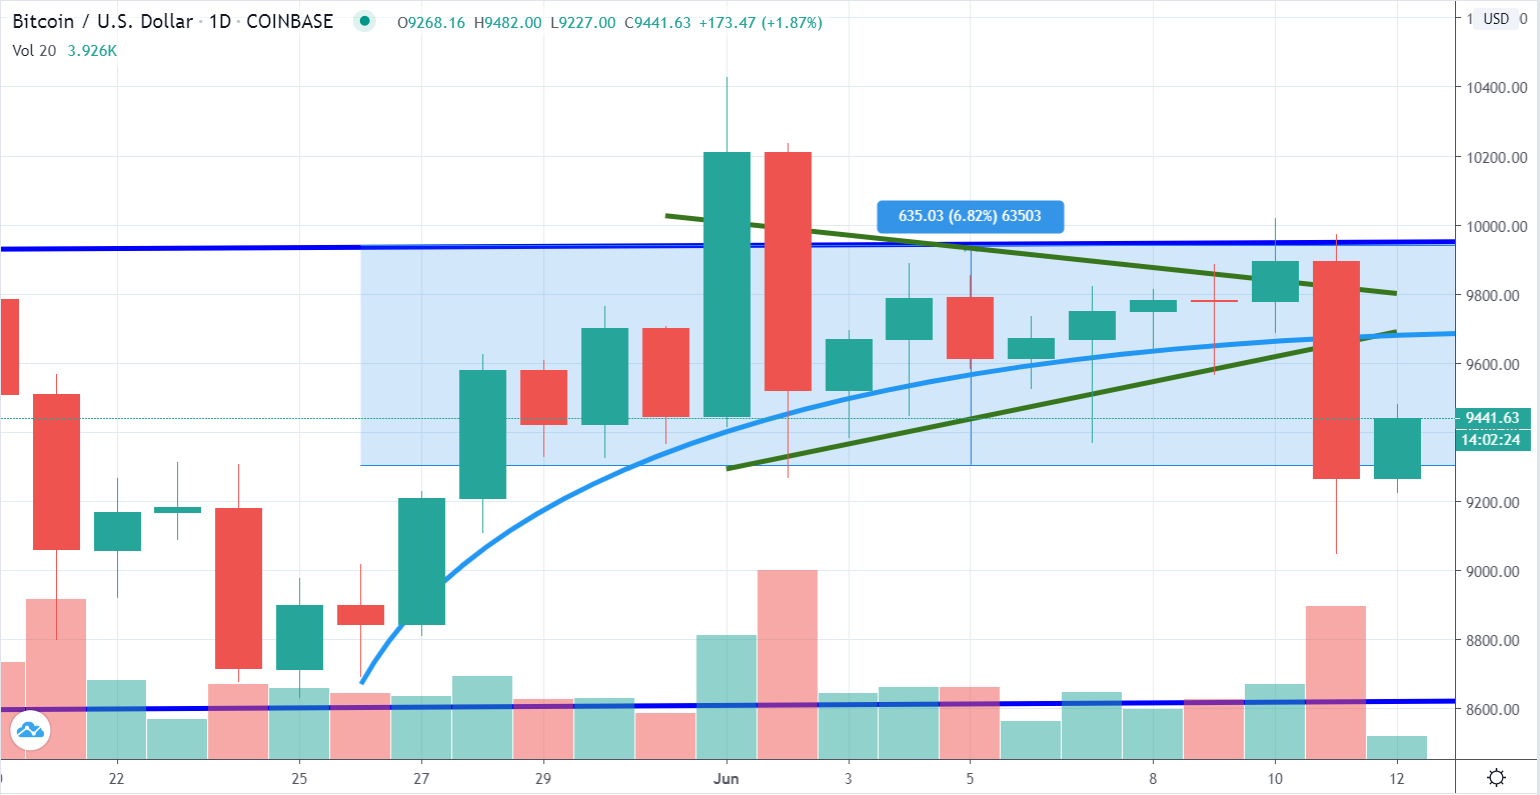
MACD and RSI indexes have lowered their values due to yesterday's drop as the MACD index reached -- 57, slowing, even more, the momentum for Bitcoin, while RSI index moved below 50, showing that any move from now, may determine the short-term future for Bitcoin's price.
Ethereum / US Dollar
Price Analysis
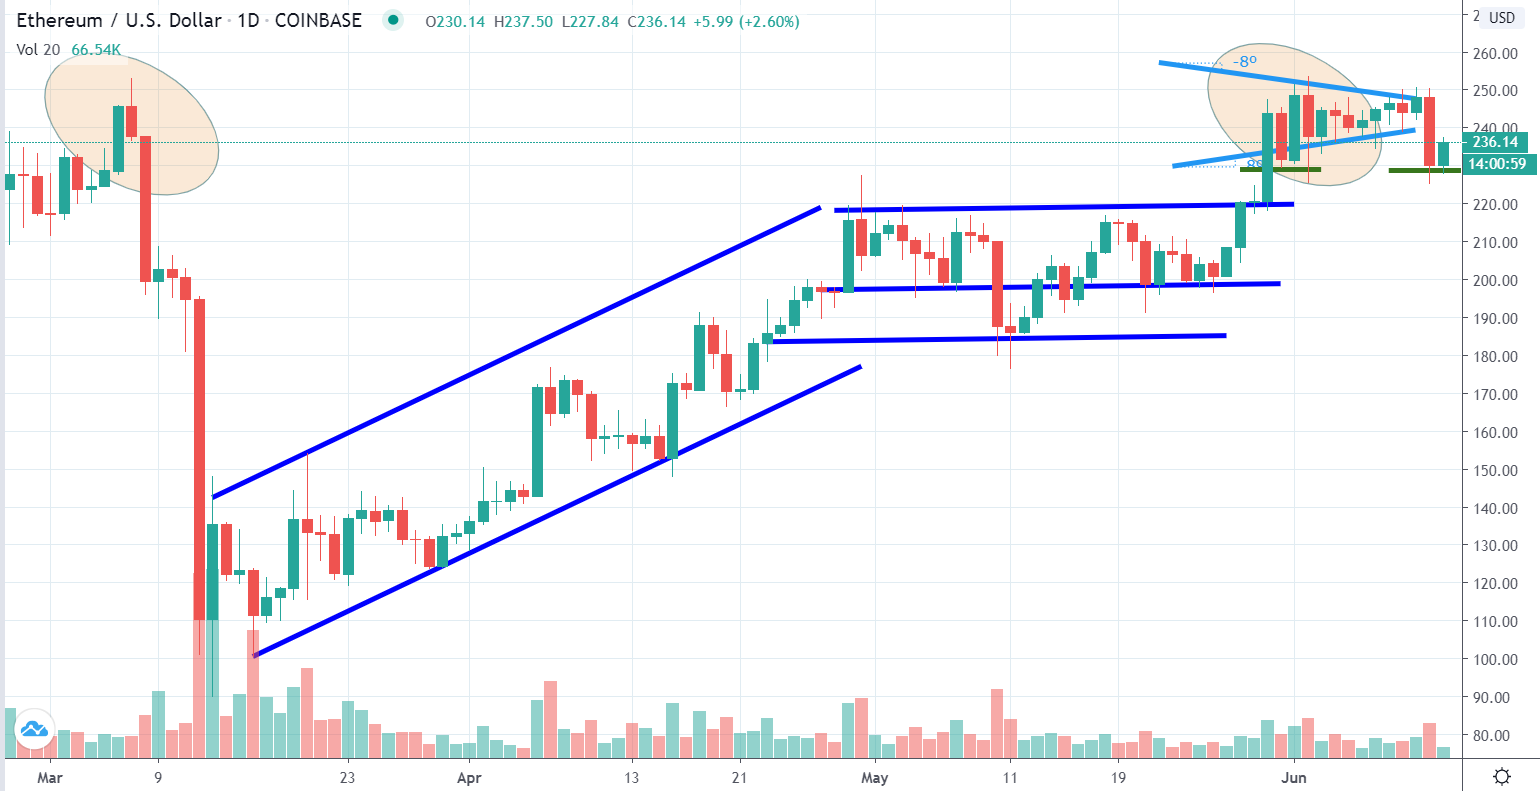
A similar pattern was formed in Ethereum as the price dropped at $230 yesterday. The symmetric triangle broke and the absorption was released downwards. The correlation between Bitcoin's price and Ethereum's price is obvious, as the moves look similar during the last days. We would like to showcase that the next support level at $230 did not break as it happened 10 days ago.
We expect Ethereum's price to continue its move according to Bitcoin's price unless there is a fundamental change in the supply side. This means we enter an uncertain period in Ethereum's price which needs much more attention from the investor's perspective.
Indicators
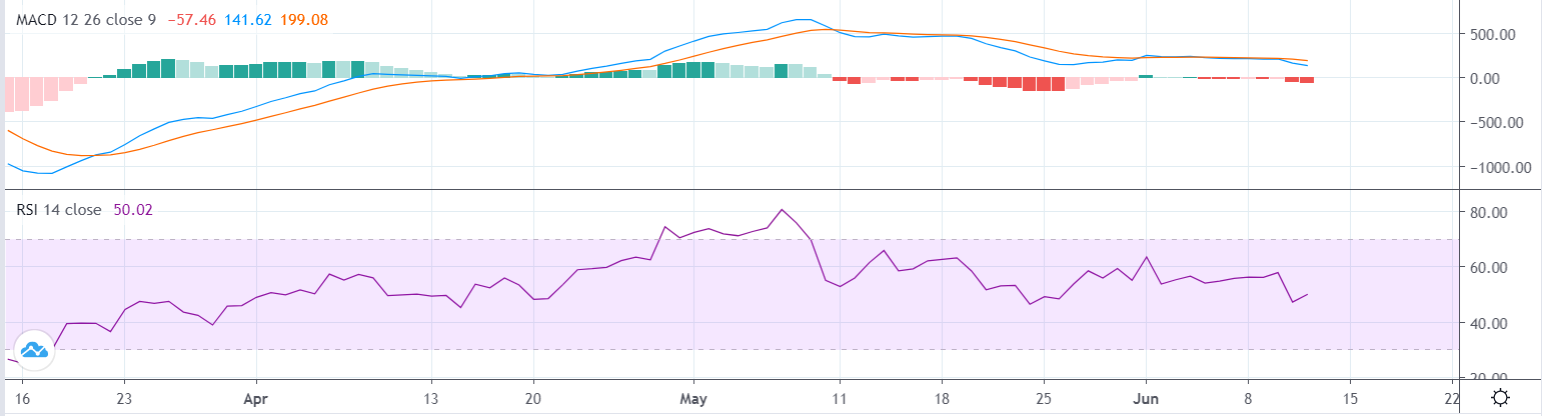
Like Bitcoin, Ethereum's indicators have slipped down, creating new opportunities for investors. MACD index turns to negative values, showing that the momentum factor has slow down without any power to move to another spike in the recent future. In parallel, the RSI index has dropped until value = 50, showing that there is uncertainty in the market, which indicates a new period without much correlation from the past prices.