The bearish resistance created proved sufficient in flipping the bullish market in favor of the bears as they succeeded in inflicting a 2.41% drop, bringing the BTC price to $40,670 per coin. With the sustained bearish action, we see the bulls attempt to contain the day's losses, resulting in the formation of the wick below the candle, which indicates the lowest trading price of the day at $40,555 per coin.
At the start of the 21st of January, we see the bears capitalizing on their previous momentum, influencing a 4.30% drop as of the time of the writing of this piece, effectively taking the Bitcoin price below $40,000 to stand at $38,923 per coin. With this move, we see the Bitcoin market trader farther away from its 50-day moving average of $46,404, strongly reflecting a bearish market over this period. The wick above the candle suggests that the bulls attempted to recover from the dip of the previous day; however, they could not surpass the bearish resistance, resulting in the bulls losing control of the market.
With the market day still far from its close, we can expect to see more volatility as the bulls try to muster a pushback, as indicated by the wick below the candle. Nevertheless, as of the writing of this piece, the highest and lowest price points achieved so far stand at $41,127 and $38,242, respectively.
With the recent market momentum, fears over the state of the market are on the rise as individuals could now be worried about the Bitcoin market is in a bear market; however, now could be a great time to increase an individual's holding with dollar-cost averaging into the market being the best option.
Indicators

Following the consecutive bearish action over the last few days, we see that the Bitcoin market has fallen within the oversold territory (an RSI below the 30 mark), reflecting the skepticism and superior selling power to the buying power.
With the above mentioned, the relative strength index over the 20th and 21st of January stands at 31 and 27, respectively.
In correlation to the RSI, we see the MACD deflect to the downside, indicating increasing negative momentum of the market. This is correlated by the histogram, which shows increasing bearish activity in the market.
Buy and sell BTC on Remitano
Ethereum / US Dollar
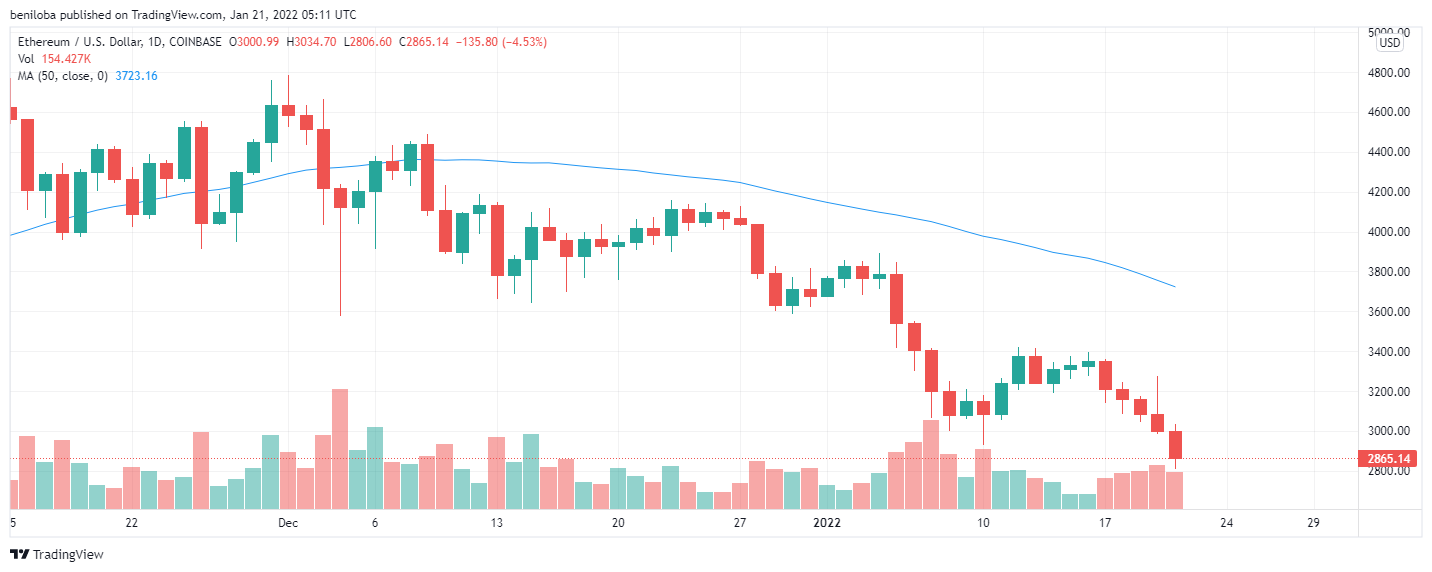
As with Bitcoin, we see that the ETH market has been on a downtrend in the short term, as indicated by the current ETH value trading below the market’s 50-day moving average of $3,723 per coin.
On the 20th of Janaury, we see the bears continue their momentum, influencing a moving that flipped the initial bullish momentum of the day (indicated by the wick above the candle). With this move, the ETH price fell by 2.73%, bringing its price to $3,000 per coin, while the highest and lowest trading prices seen during the day stand at $3,273 and $2,986, respectively.
On the 21st of January, the bears flipped an initial bullish momentum, influencing a 4.53% price drop which successfully brought the ETH market back below the $3,000 mark, at $2,865 per coin. With so much time left on the clock, we could see the bears maintain their momentum, resulting in a further fall in the ETH price, but this is being challenged by the bulls, as indicated by the wick below the candle. Nevertheless, as of the writing of this piece, the highest and lowest price points achieved so far stand at $3,034 and $2,806, respectively.
Indicators
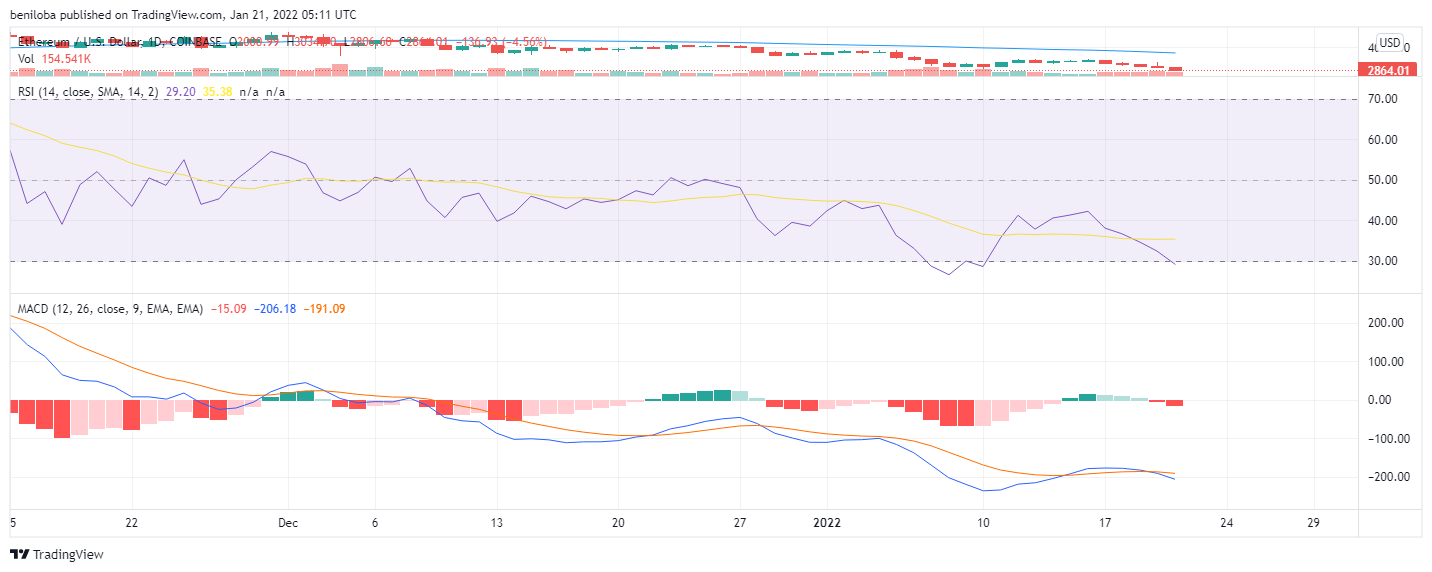
Following consecutive bearish action, we see ETH fall into an oversold market as its relative strength index over the last two days stands at 32 and 29, respectively, and with the ETH market on the 21st of Janaury still, far from its end, we could see further fall in these values. In correlation to the relative strength index, we see the histogram show increasing bearish activity in the market. This is reflected on the MACD as a deflection to the downside, indicating a bearish outlook for the asset.
Buy and sell ETH on Remitano
Ripple / US Dollar

The Ripple market has remained in a downtrend ever since the bull’s attempt to get back above the 50-day moving average faltered, which continued on the 20th and 21st of January.
On the 20th of January, we see the bears falter an initial bullish momentum, resulting in a 2.61% drop, bringing the Ripple price to $0.718 per coin, while the highest and lowest price points achieved so far in the market stand at $0.761 and $0.716, respectively.
We see a continuation of the bearish action on the 21st of Janaury, as the bears flipped an initial bullish attempt at market control and influenced a 3.20% drop, bringing the XRP price to $0.695 per coin.
However, with the market still in its early hours, we could see sustained bearish action, which could push the XRP price even lower; however, the wick below the candle (denotes the lowest trading price for the day, $0.686) illustrates bullish resistance to a further price drop. The wick above the candle indicates the highest trading price of $0.728 per coin.
Indicators

With consecutive days of bearish action, we see the relative strength index progress towards the 30 mark below, which would place the Ripple market in an oversold scenario. On the 20th and 21st of January, the relative strength index fell to 34 and 31, respectively, indicating increasing selling pressure in the market.
In correlation to the relative strength index, the histogram portrays increasing bearish activity in the market, reflecting on the MACD as it deflects further below the zero line, creating a bearish outlook for the Ripple market.
Buy and sell XRP on Remitano
Litecoin / US Dollar

From the chart above, we see that the bulls started the market ahead on the 20th of January; however, bearish resistance to market growth resulted in the bulls losing their hold on the market, and the bears influencing a 4.70% price decrease, translating to $129 per coin with the highest and lowest price points achieved so far at $142 and $128, respectively, indicated by the wicks above and below the candle.
At the start of the 21st of January, we see the bears capitalizing on their momentum of the previous day, influencing a 4.15% drop as of the writing of this piece, bringing the litecoin price to $124 per coin. With the market still far from its close, we could see further price action as the bulls are seen attempting to contain the price drop, indicated by the wick below the candle.
Nevertheless, as of the writing of this piece, the highest and lowest price points achieved stand at $131 and $121, respectively.
Indicators

As a reflection of the bearish market over the last few days, we see the relative strength index fall into bearish territory(below the 50 mark), indicating increasing bearish activity in the market. With that said, the relative strength index on the 20th and 21st of January stands at 38 and 35, respectively.
In correlation to the relative strength index, we see a halt in the MACd’s ascent to the zero line, reflecting recent sustained bearish activity. This is correlated by the histogram, which shows budding bearish activity, portraying a negative outlook for the market.
Buy and Sell LTC on Remitano
Bitcoin Cash / US Dollar

From the above chart, we see that the Bitcoin Cash market remains below its 50-day moving average of $424, reflecting the downtrend the Bitcoin Cash market has been on, and this is continued on the 20th of January as the Bitcoin cash price fell by 3.08%, bringing its price to $357 per coin with the highest and lowest price points achieved being $384 and $356 per coin.
On the 21st of January, the bears are seen capitalizing on the previous momentum, resulting in a 4.50% price drop, bringing the Bitcoin Cash price to $341 per coin. With the market in its early hours, the bears could increase their momentum as the bulls have not created a substantial resistance to further price fall. Nevertheless, the highest and lowest price points as of the writing of this piece stand at $360 and $338, respectively.
Indicators
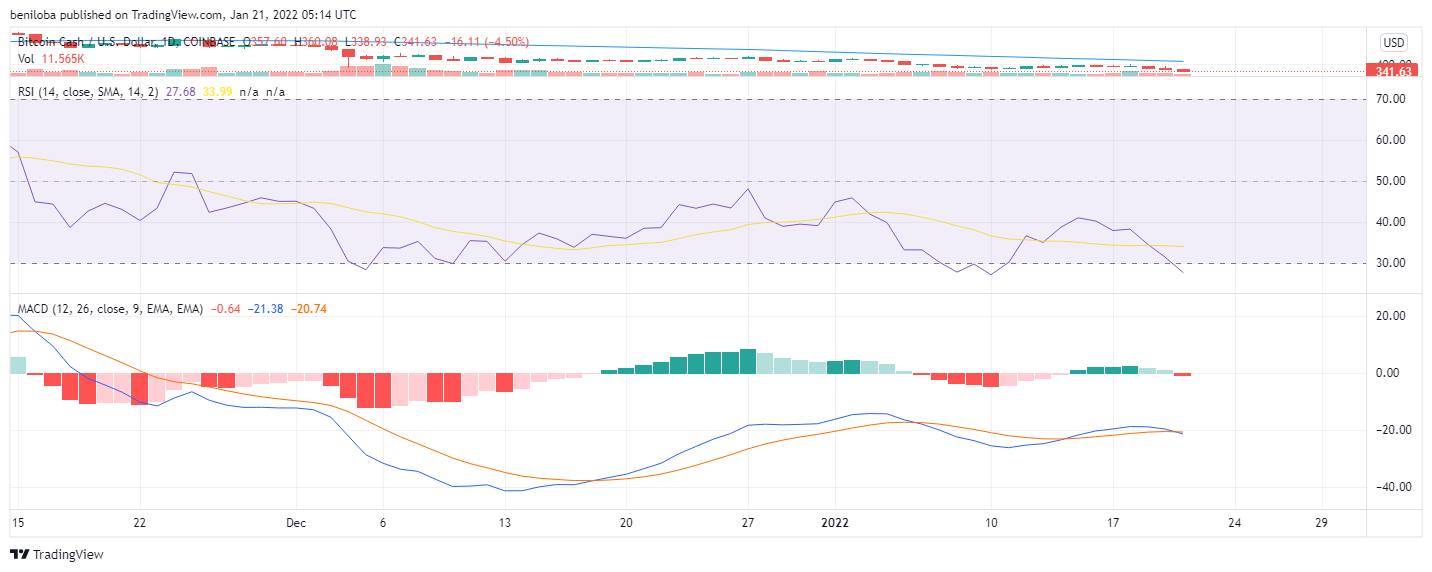
Following sustained bearish action on the 20th and 21st of January, we see the relative strength index fall below the 30 mark, indicating that the Bitcoin market has entered an oversold scenario with values across these last two days being 31 and 27, placing the bears in control of the market momentum.
The histogram flips below the zero line, signifying the market's bearish control, which is correlated by the MACD, which deflects to the downside, maintaining its bearish position below the zero line.
Buy and sell BCH on Remitano
Cardano / US Dollar
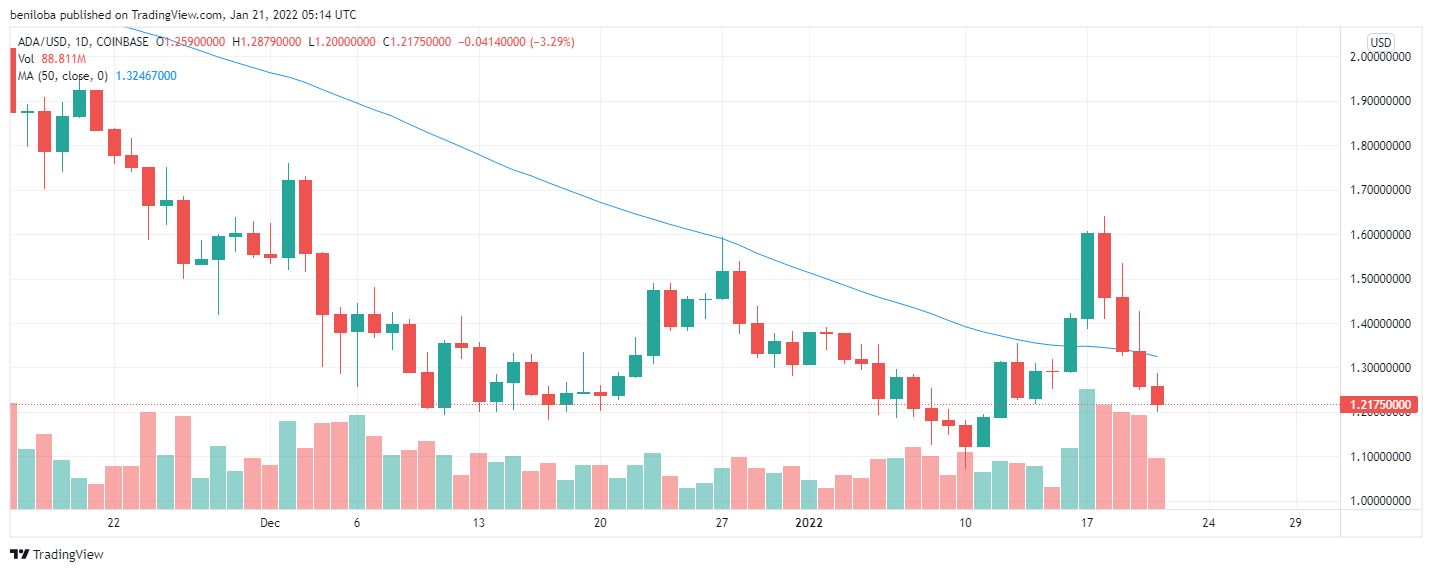
The bulls attempted to get the ADA market back above its 50-day moving average of $1.32 on the 20th of January; however, this move was quickly rejected (indicated by the wick above the candle) and flipped into bearish, which saw the ADA market fall further below its moving average with a 5.81% drop, bringing the ADA price to $1.258 per coin.
On the 21st of January, we see the bears reestablishing their momentum yet again rejecting an initial bullish move, placing the highest trading price of the day at $1.287 per coin.
Following the bearish start, the bears succeeded in inflicting a 3.29%, bringing the ADA price to $1.217 per coin. However, with the market still in its early hours, we could see a struggle as the wick below the candle suggests the bulls resist further price drop, placing the lowest trading price at $1.20 per coin.
Indicators

Following consecutive bearish action, the relative strength index of ADA is back below the 50 mark, indicating a shift in the market momentum into bearish predominance. With the above statement, the relative strength on the 20th and 21st of January stands at 46 and 44, respectively.
The MACD shows a deflection below the zero line, indicating bearish momentum being predominant in the market. This is correlated by the histogram, which shows diminishing bullish activity in the market.
Swap to ADA
Dogecoin / US Dollar

From the chart above, we see that the Dogecoin price has consistently attained lower highs and lower lows, and this is seen on the 20th of January as the Dogecoin price fell by 3.84%, bringing the Dogecoin price $0.155 per coin. On the 21st of January, we see the bears continuing their momentum, influencing a 2.70% drop, bringing the Dogecoin price to $0.151 per coin.
However, with the market being in its early hours, we expect these values to change. Nevertheless, as of the writing of this piece, the highest and lowest prices achieved stand at $0.157 and 0.148, respectively.
With both values across these days being below the 50-day moving average of $0.170, the Dogecoin market remains in a downtrend.
Indicators
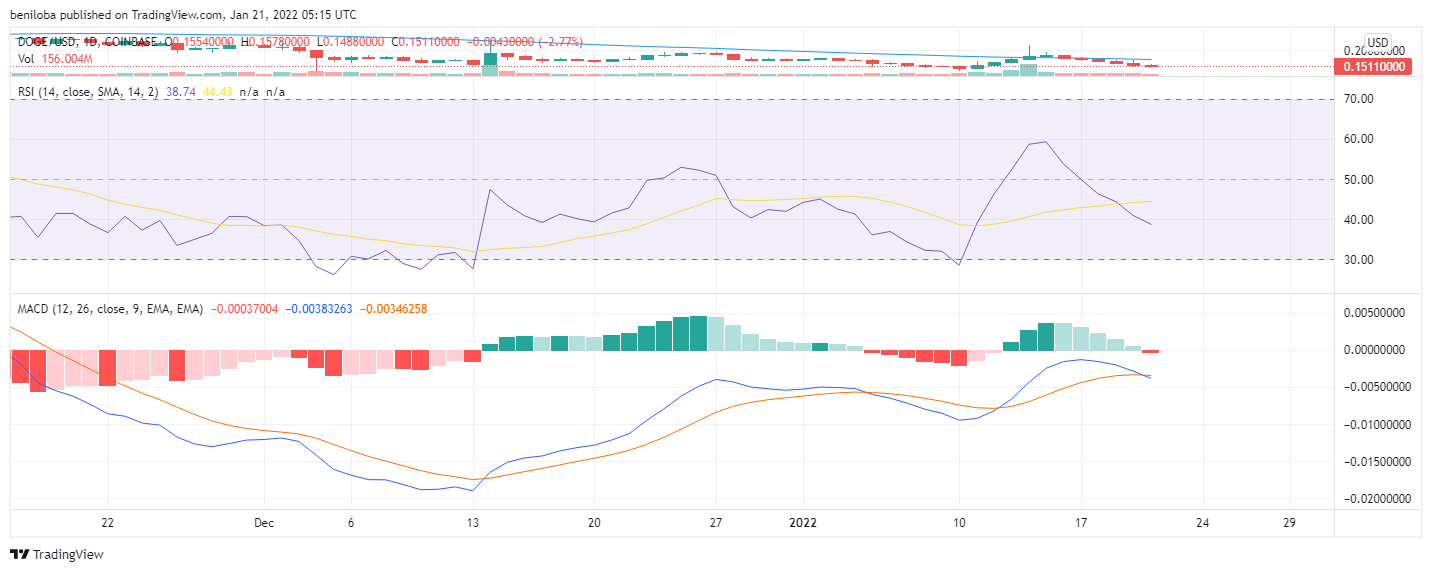
Following sustained bearish action on the 20th and 21st of January, the relative strength index has fallen below the 50 mark, indicating increasing selling pressure in the market. The RSI values across these days are 40 and 38, respectively.
In correlation to the RSI, we see the histogram flips below the zero line, signifying a shift in the market momentum to bearish Favour. This is agreed by the MACD, which deflects to the downside, portraying a negative outlook for the market.
Swap to DOGE
Correlations
- Bitcoin / Ethereum = 0.89
- Bitcoin / Ripple = 0.87
- Bitcoin / Litecoin = 0.86
- Bitcoin / Bitcoin cash = 0.85
- Bitcoin / Cardano = 0.78
- Bitcoin / Dogecoin = 0.82
With the market Dip creating more uncertainty for investors and traders, the best course of action would be to increase holdings of top assets as they are cheaper now. Therefore, the need for a suitable tool to buy, sell, and swap tokens can’t be overemphasised.
Remitano’s swap tool provides such functionalities.
Keynotes for today
- Bitcoin at $38,923 per coin.
- Ethereum at $2,865 per coin.
- Ripple at $0.695 per coin.
- Litecoin at $124 per coin.
- Bitcoin Cash at $341 per coin.
- Cardano at $1.217 per coin.
- Dogecoin at $0.151 per coin.