Signals Indicate that BTC could Experience a more Extended Consolidation Phase

News • 2020/11/10 • by
remitano

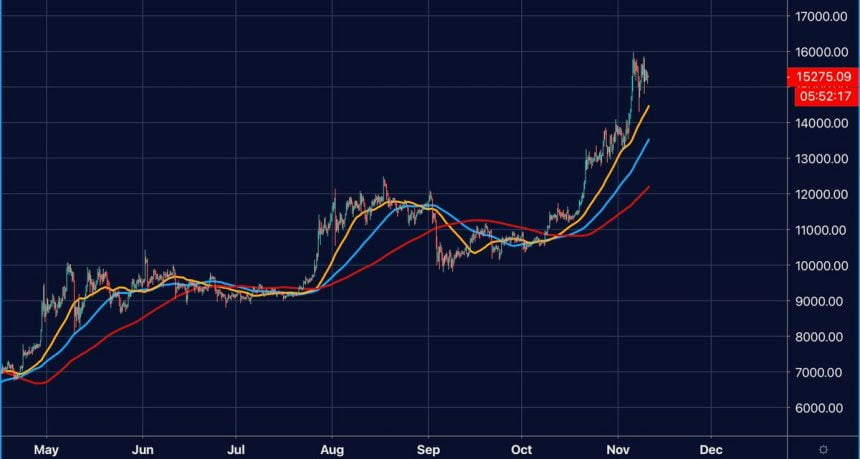
BTC has witnessed significant volatility in the past few days, reaching a high of about $15,800 yesterday before dropping to $14,800.

In the short term, the market's direction remains uncertain as any weak movement below the $16,000 may confirm a strong resistance point, followed by a continuous dip.

Although buyers' strength during price falls implies that the crypto has strong support, the market's direction will significantly depend on the reaction to the bear pressure around the $16,000 level.
Major update

  • Bitcoin remains highly volatile after 48hrs
  • The bitcoin consolidation phase may last months.
  • Bitcoin may deep lower than 15K in the coming days.
  • The market direction depends on the strength of 16K resistance.

If it cannot go beyond this level and dips lower than the $15,000 mark, it could be a potential weakness indicator, leading to a further dip in the following days. However, a trader revealed that analysis indicates that BTC is going into an extended consolidation phase.

He stated that the last time these indicators showed the kind pattern seen recently, Bitcoin consolidated for several months before moving downwards and later making an upward movement. Next week should give a hint of whether this marks the beginning of a long BTC consolidation phase.

What do you think about the Bitcoin consolidation phase? Let's discuss this in the comment section.


Comments (3)
Guest
visiblemoney
6 years ago
I think bitcoin consolidation phase is the destiny of a longer uptrend that will make its pass around $20,000 mark.
ajii12
6 years ago
we are excited about getting closer to the 20k mark
exodusab
6 years ago
BTC/USD The bulls are struggling to propel Bitcoin (BTC) above the $13,200–$13,343.66 resistance zone. This suggests that after the initial frenzy, buying has dried up at higher levels. BTC/USD daily chart. Source: TradingView The failure to sustain above $16,500 could attract profit booking by the short-term traders that may result in a pullback to the $16,000 - $17,000 support zone. However, the upsloping moving averages and the relative strength index in the overbought territory, shows that the bulls are in command. Therefore, the bulls might buy the dip to the 20-day exponential moving average ($16,000). ETH/USD The tight range consolidation of the past three days has resolved the downside. The bears have dragged Ether (ETH) back below $395 but the bulls are attempting to keep the price above the 20-day EMA ($400). ETH/USD daily chart. Source: TradingView If the ETH/USD pair rebounds off the 20-day EMA and rises above $400, it will suggest strong accumulation at lower levels. A breakout of $420 will signal the possible resumption of the uptrend. However, the 20-day EMA is flattening out and the RSI is just above the midpoint, which suggests a balance between supply and demand. If the bears sink the price below the 20-day EMA, it will suggest that the momentum has weakened. A break below the uptrend line may intensify the selling. XRP/USD The failure of the bulls to push XRP above the $0.26 resistance in the past few days may have attracted profit booking by the short-term traders. The altcoin has broken below the 20-day EMA ($0.249) and is currently attempting to stay above the 50-day SMA ($0.244). XRP/USD daily chart. Source: TradingView If the XRP/USD pair rebounds off the 50-day SMA, the bulls will make one more attempt to push the price above $0.26. If they can pull it off, the pair is likely to pick up momentum and rally to $0.30. On the other hand, if the bears sink the price below the 50-day SMA, the pair could extend its stay inside the $0.2295–$0.26 range for a few more days. The flattening moving averages and the RSI just below 50 also point to a possible range-bound action in the short-term. BCH/USD The failure of the bulls to propel Bitcoin Cash (BCH) above the $280 resistance attracted profit booking by the short-term traders. This selling has dragged the price down to the 20-day EMA ($252). BCH/USD daily chart. Source: TradingView If the BCH/USD pair rebounds sharply from the 20-day EMA, it will suggest accumulation at lower levels. The bulls will then again try to push the price above the overhead resistance at $280. If they succeed, the rally may extend to $300 and above it to $326.30. Conversely, if bears sink the price below the 20-day EMA, the BCH/USD pair could drop to $242. Such a move will suggest that the pair could remain range-bound for a few more days. The RSI has formed a negative divergence, which suggests that the bullish momentum may be weakening. LINK/USD Chainlink (LINK) has turned down from close to $13 levels and the bears will now attempt to pull the price back below the $11.8028–$11.1990 support zone. If they succeed, it will suggest that the recent breakout of $11.8028 was a bull trap. LINK/USD daily chart. Source: TradingView A break below the moving averages could signal further weakness and the trend will turn in favor of the bears if the uptrend line also fails to provide support. On the other hand, if the LINK/USD pair rebounds off the $11.8028-$11.1990 support, it will suggest that the bulls are buying the dips. The bulls will then make one more attempt to propel the pair above $13.28. If they succeed, the uptrend is likely to pick up momentum with a rally to $15 and then to $17. BNB/USD Binance Coin (BNB) remains in an uptrend and the bulls have held the support at $29.5646 for the past four days. The upsloping moving averages and the RSI above 57 signals that bulls are in command.

Our newsletter

The latest cryptocurrency market news, technologies, and help resources.


