Bitcoin / US Dollar

From the chart above, we see that the Bitcoin market is still experiencing downward action, and this is continuing on the 4th of January. On the 4th, the bearish dominance of the market is seen to come off an initial bullish action as indicated by the wick above the candle; however, resistance (also indicated by increased selling volumes) provided by the bears was sufficient to flip the market in their favour, resulting in a drop of 1.39%, bringing the Bitcoin price to $45,814 per coin. The wick below the candle indicates bullish resistance to further downward action, placing the lowest trading price point at $45,515, while the highest trading price for the day stands at $47,532 per coin.
At the start of the 5th of January, the chart shows a budding green candle, indicating a bullish push for dominance as correlated by a minute increase in buying volumes. With the market still well in its early hours, the dominant force of the day is not fixed as sustained bullish action will cause increased buying volumes and price. At the same time, bearish resistance turned into possible momentum that could see increased selling volumes and a price drop. Nevertheless, the Bitcoin price is up 0.20%, bringing its price to $45,907, with the highest and lowest trading prices being $45,945 and $45,711, respectively.
As earlier stated, the Bitcoin market is still in a downtrend. This is indicated by the formation of lower highs and lower lows and the market's trading below its 50-day moving average of $51,329.
Indicators
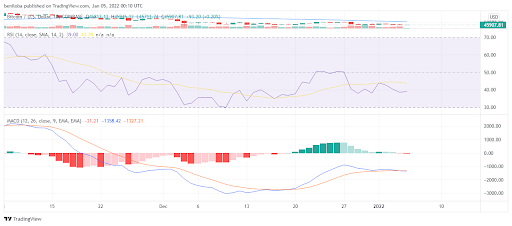
The chart above illustrates a market below the 50 mark, indicating the dominance of selling above buying, placing the market momentum in favour of the bears. With the continued bearish action on the 4th of January, we see the relative strength index fall to 38.59. The bullish action on the 5th of January, though minor, has resulted in the relative strength index increasing to 39, illustrating the bullish entry into the market.
Following sustained bearish action in the market, the MACD remains below the zero line, indicating negative momentum of the market. The histogram, placed in the bearish region, shows the increasing bearish activity of the market. With these, the bears seem to have a hold on the market.
Ethereum / US Dollar

From the above chart, we see that the Ethereum market remains in a downtrend over an extended period, while a look at the chart in the short term shows that the Ethereum market over the last week is in an uptrend.
On the 4th of January, we see the bulls take control of the market, while the huge wicks on both sides of the candle illustrate the struggle between the bulls and the bears for market dominance. The wick above the candle indicates the highest price point achieved in the market from which the bears rejected further bullish action. Therefore, this price point stands at $3,893, while the wick below the candle indicates the bears had the early start in the market, but the bulls flipped the momentum, placing the lowest trading price seen at $3,714 per coin. Despite the market volatility, the bulls succeeded in influencing a 0.50% growth to bring the ETH price to $3,785 per coin.
With the market in its early hours on the 5th of January, we see the bears leading in the market; however, as with the previous day, the bearish market dominance is not fixed as the bulls can muster a move to gain market dominance. Nevertheless, as at the writing of this piece, the ETH market is down 0.09%, bringing the ETH price to $3,781 per coin, with the highest and lowest price points seen so far standing at $3,790 and $3,765, respectively.
As stated earlier, the ETH market remains in bearish control over an extended period, which is correlated by the market trading below its 50-day moving average of $4,088.
Indicators

The chart above illustrates a bearish market momentum, as indicated by a relative strength index below the 50 mark and a MACD placed below the zero line.
On the 4th of January, the bullish action in the market caused an increase in the relative strength index to 43.73, while the bearish start on the 5th of January saw this value fall to 43.59.
The Histogram, unlike the MACD, illustrates a reduction n the bearish activity seen in the market, and this is due to a gradual increase in bullish entry into the marker.
Ripple / US Dollar

As with several other assets, the Ripple market remains in a downtrend as it trades below its 50-day moving average of $0.909, indicating the predominance of bearish action over this period.
The 4th of January sees a continuation of this bearish action as indicated by increased selling volume in the market. The bearish action can be seen to have been initiated in response to an initial bullish push for market dominance, which saw bearish resistance turn into momentum, indicated by the wick above the candle. With this bearish action, the XRP price dropped by 1.14%, bringing the XRP price to $0.822 per coin. The wick above the candle illustrates the highest trading price ($0.845) seen in the market from which the bears rejected further price growth, while the lowest trading price seen in the market stands at $0.815 per coin.
On the 5th of January, the chart illustrates a bullish response to the bearish momentum of the previous day as indicated by the green candle and increasing buying volumes in the market. The bullish action on this day has resulted in a 0.13% price gain to bring the Ripple price to $0.823 per coin, while the highest and lowest price points are seen standing at $0.825 and $0.821, respectively. With the market well in its early hours, there is much volatility left to be seen, which could either see the bulls maintain dominance or the bears flip the market in their favour.
Indicators

Following the bearish action on the 4th of January, the Ripple market remains in a downtrend, and this is correlated by the relative strength index, which is placed below the 50 mark, the MACD, which is placed below the zero line, and the histogram which shows increasing bearish activity in the market. The cumulative result of the above indicators places the bears as the dominant force in the market, portraying a negative outlook for the market within this period.
With the above, we see the relative strength index fall on the 4th of January to 42.23, while the budding bullish action during the early hours of the 5th of January sees the RSI value increase to 42.41.
With the market still in its early hours, the RSI value on the 5th of January is subject to change depending on which party comes out as the dominant force.
Litecoin / US Dollar

The Litecoin market is yet to significantly move towards its 50-day moving average of $172, maintaining the market in a downtrend over this period.
From the above chart, it is apparent that the LTC market has been experiencing sideways action since December, and this seems to have continued on the 4th and 5th of January.
On the 4th of January, we see that the bulls lost their market dominance to the bears, as indicated by the wick above the candle (which indicates the highest trading price point). Following this bearish action, the LTC market experienced a 1.34% drop to bring the LTC price to $146 per coin, with the highest and lowest price points achieved so far being $151 and $145, respectively.
During the early hours of the 5th of January, we see the bulls kicking to get control of the market, as indicated by a green candle and increased buying volumes. From the chart, we see that despite the bulls' early start, the gain is not significant; therefore, sufficient bearish opposition could see the bears gain control of the market.
Nevertheless, as of the writing of this piece, the Litecoin market is up 0.37%, bringing the LTC price to $146 per coin, while the highest and lowest trading prices seen so far stand at $146 and $145, respectively.
Indicators

Due to the bearish action on the 4th of January, we see the fall of the relative strength index to 39.67, indicating increasing bearish activity in the market. However, the bullish attempt at dominance during the early hours of the 5th of January has increased the RSI to 40.22. With many times left in the market, we could see either an increased RSI, corresponding to increasing bullish dominance, or a reduced RSI, corresponding to bearish dominance of the market.
From the above chart and values, the LTC market remains predominantly bearish as the RSI is placed in the bearish zone ( below the 50 mark), and the MACD is placed below the zero line. Despite the bearish outlook of the market, the histogram is placed in bullish territory but shows reducing intensity.
Bitcoin Cash / US Dollar

As with several altcoins, the Bitcoin Cash market experienced bearish action on the 4th of January, resulting in a 1.66% drop to bring the Bitcoin Cash price to $427 per coin, with the highest and lowest trading prices being $439 and $425, respectively.
Following the bearish action of the previous day, we see the bulls responding on the 5th of January in a move that has caused an increase of 0.33% to bring the Bitcoin Cash price to $428 per coin. With the Bitcoin Cash market still in its early hours, these values are subject to change. However, as of the writing of this piece, the highest and lowest price points achieved so far stand at $429 and $426, respectively.
From the above, we see that the Bitcoin Cash market remains well below its 50-day moving average of $489, maintaining the asset in a downtrend.
Indicators

On the 4th of January, the bearish action caused a fall in the relative strength index to 39.82, indicating increasing bearish selling compared to buying in the market. With the early bullish push for dominance on the 5th of January, we see a slight increase of the RSI to 40.43.
The MACD being below the zero line indicates the overall bearish momentum in the market. With the continued bearish action, we see the histogram portray reducing bullish activity in the market.
Cardano / US Dollar

From the above chart, it is clear that the ADA market is in a downtrend, and this is correlated by the market trading below its 50-day moving average of $1.46.
The downtrend continued on the 4th of January as the ADA market experienced a 0.71% drop to bring the asset price to $1.30 per coin. The presence of the wick above the candle suggests the bulls had the early move in the market, which was heavily resisted by the bears who succeeded in turning it into momentum. In contrast, the wick below the candle suggests bullish rejection to further price fall. With these, the highest and lowest trading prices achieved stand at $1.351 and $1.309, respectively.
Following the bearish action of the previous day, we see on the 5th of January that the ADA bulls are responding with a 0.25% increase in the early hours of the day, bringing the ADA price to $1.312 per coin. As of the writing of this piece, the highest and lowest trading prices seen so far stand at $1.316 and $1.303, respectively. However, with so much time left on the clock, we could see a shift in the market momentum.
Indicators

The relative strength index below the 50 mark over the last two days indicates that bearish selling dominates the market. On the 4th and 5th of January, we see RSI’s of 44.13 and 44.49, respectively, illustrating the bullish momentum seen on the 5th.
The MACD below the zero line corresponds to RSI, portraying the dominance of the bears. However, the histogram reflects a steady reduction in activity in the market.
Dogecoin / US Dollar

The Dogecoin market still trades well below its 50-day moving average of $0.189, maintaining it in a downtrend. We see bearish action on the 4th of December, resulting in a 1.12% drop to bring the Dogecoin price to $0.168 per coin. On the 5th of January, we see the bulls responding to the previous day's move by influencing a 0.24% increase to bring the Dogecoin price to $0.168 per coin during the early hours of the day.
With so much time on the clock, we could see a shift in the dominance of the market; however, as of the writing of this piece, the highest and lowest price points achieved stand at $0.169 and $0.167, respectively.
Indicators

The relative strength index across the 4th and 5th of January stands at 41.32 and 41.77; however, though the increase shows bullish action, the RSI remains below the 50 mark, indicating an overall bearish dominance of the market.
In correlation to the RSI, we see the MACD below the zero line, indicating the bearish dominance of the market. In contrast, over the short term, we see the histogram depict reducing bullish activity in the market, correlating to the increase in bearish action seen over this period.
Correlations
- Bitcoin / Ethereum = 0.88
- Bitcoin / Ripple = 0.84
- Bitcoin / Litecoin = 0.88
- Bitcoin / Bitcoin cash = 0.85
- Bitcoin / Cardano = 0.88
- Bitcoin / Dogecoin = 0.85
Keynotes for today
- Bitcoin breaks below $47,000. Currently stands at $45,907 per coin.
- Ethereum at $3,781 per coin.
- Ripple at $0.823 per coin.
- Litecoin at $146 per coin.
- Bitcoin Cash at $428 per coin.
- Cardano at $1.312 per coin.
- Dogecoin at $0.168 per coin.