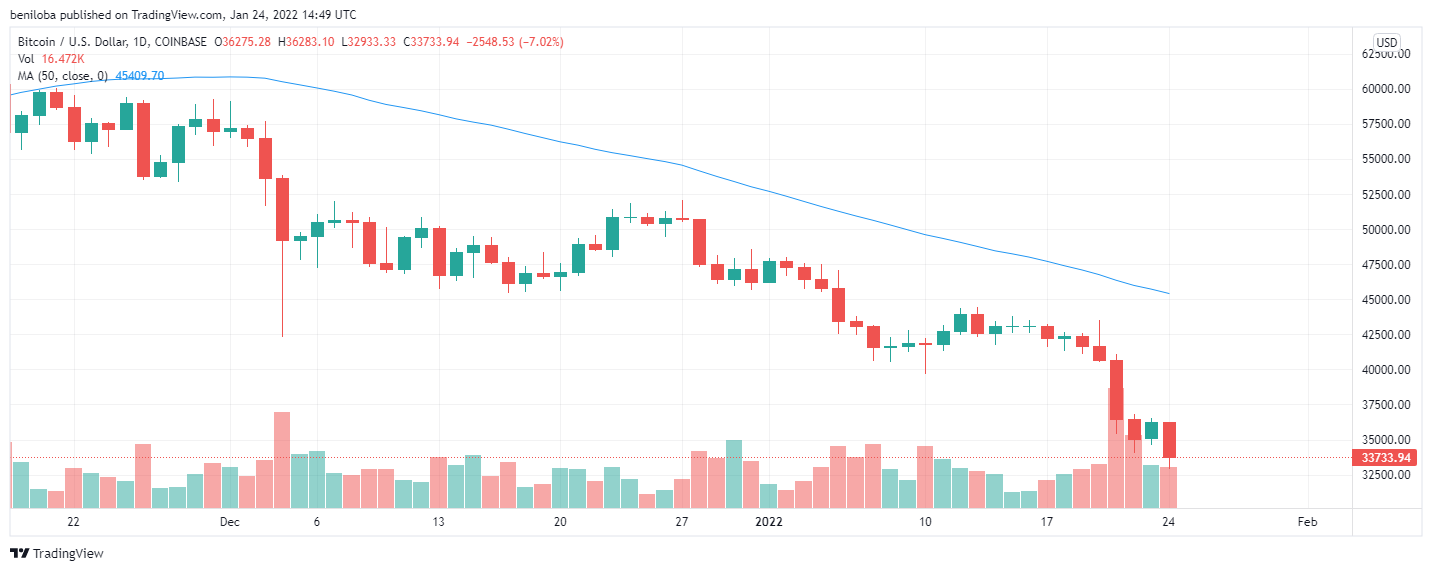
At the start of 23rd January, we see the bulls attempting to gain control of the market early on; however, immediate resistance by the bears sees the bulls lose their momentum, placing the bears who have already influenced a 0.12% drop ( translating to $35,023 per coin) in control of the market. With the market very much in its early hours, we will likely see more volatility during the day. Nevertheless, as of the writing of this piece, the highest and lowest price points achieved so far stand at $35,547 and $34,952, respectively.
On 24th January, we see the bears continuing their action following the bullish action of the previous day. As of the writing of this piece, the Bitcoin price is down by 7.02% in the last 24 hours, bringing the bitcoin price to $33,733 per coin, with the highest and lowest price achieved so far standing at $36,283 and $32,933, respectively.
From the above values, we see that the Bitcoin price continues to trade below its 50-day moving average of $45,409, reflecting the market downtrend.
Indicators
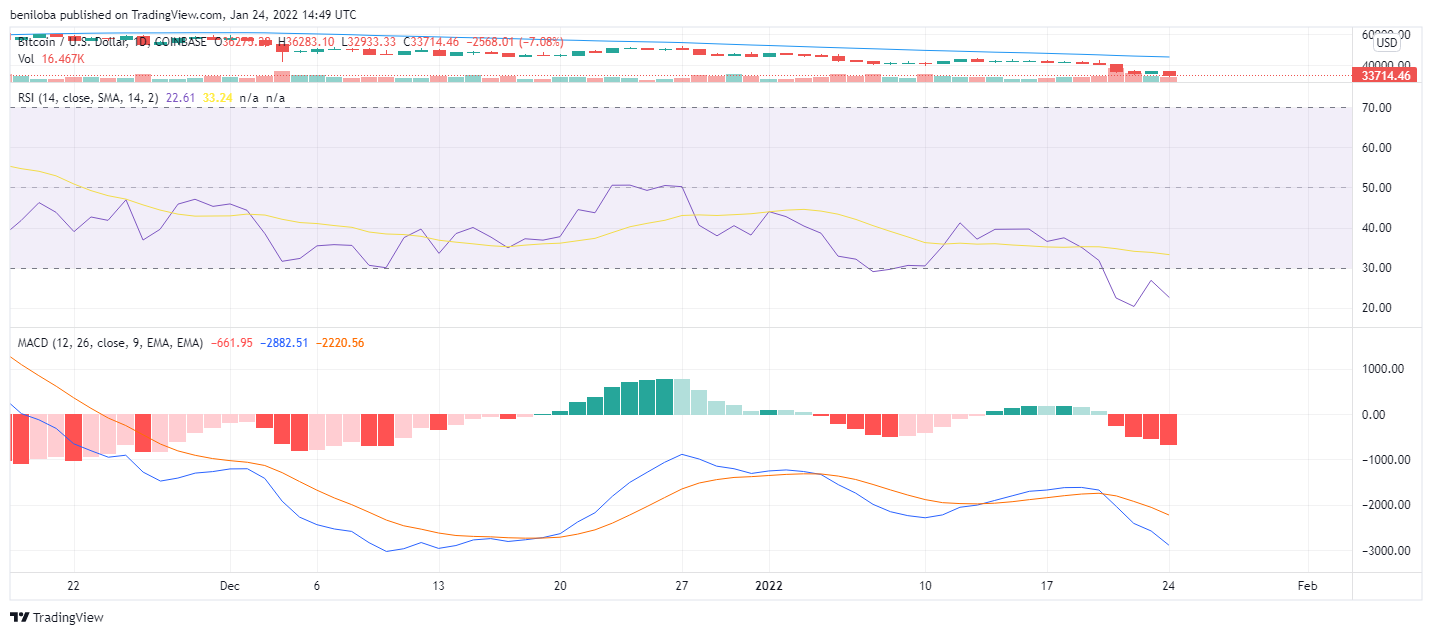
Following sustained bearish action on the 22nd and 23rd of January, we see the relative strength index continue its fall well into an oversold market as the values across these days place below the 30 mark, at 20.29 and 20.26, respectively. As of the writing of this piece, the market remains in bearish dominance; however, with the market in its early hours, we could see more volatility. Following the continued bearish action on the 24th of January, we see the relative strength index fall to 22, well within the oversold region.
In correlation to the relative strength index, we see the MACD continue its descent below the zero line, together with the histogram, a clear reflection of the bearish dominance of the market.
Buy and sell BTC on Remitano
Ethereum / US Dollar

We see the Ethereum market fall well into bearish control with several crypto assets. On the 22nd of January, the bears resisted an attempt by the bulls to revive the market following the massive dip that occurred on the 21st of January, indicated by the wick above the candle and placing the highest trading price point for the day at $2,628. Also, from the chart, we see the bears were able to sustain their resistance which turned into momentum and effectively flipped the market in their favor, influencing a 6.12% price drop, translating to $2,411 per coin, while the lowest trading price for the day stands at $2,301 per coin.
On the 23rd of January, we see the bears taking an early lead in the market, influencing a 0.51% drop as of the writing of this piece, bringing the Ethereum price to $2,399 per coin. The wick above the candle suggests the bulls attempted to make an early move for dominance but quickly met bearish opposition. Nevertheless, the highest and lowest price points stand at $2,463 and $2,397, respectively.
The Ethereum price is down by 13.07% on the 24th of January, bringing the asset price to $2,209, which falls way below the market’s 50-day moving average of $3,209, a clear reflection of the current market downtrend.
indicators
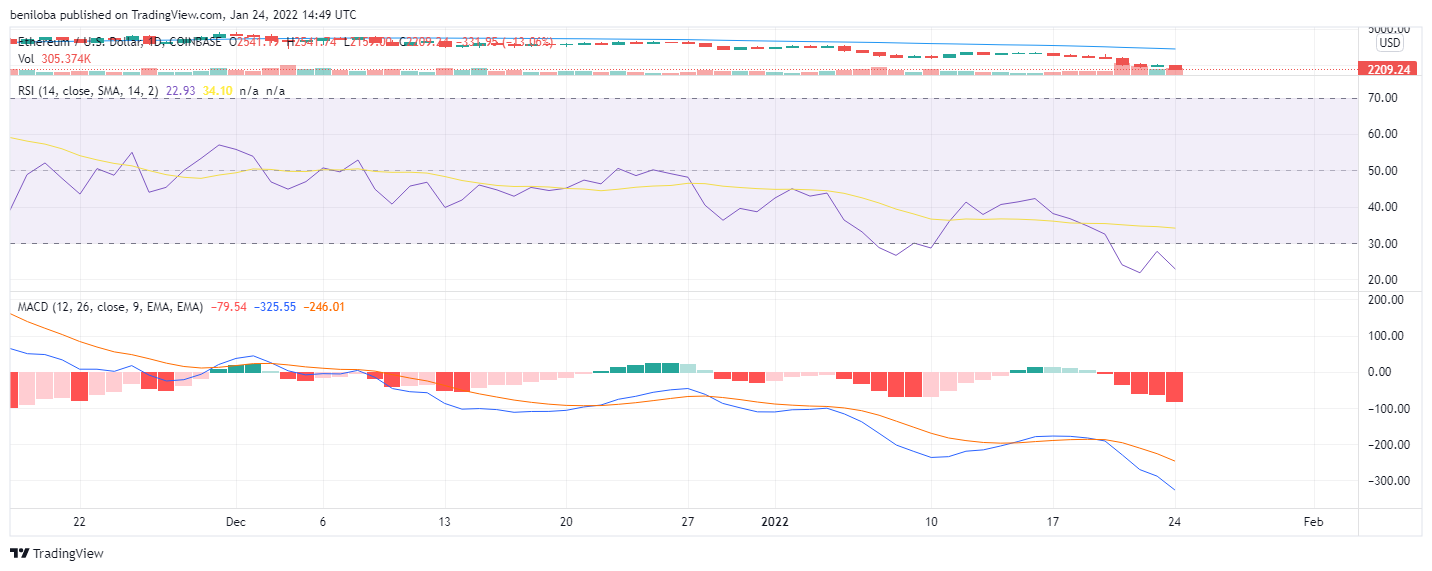
The above chart shows that the Ripple market is currently oversold as the relative strength index on the 22nd, 23rd, and 24th of Janaury stands below the 30 mark, at 21.82, 21.65, and 22, respectively.
In correlation to the relative strength index, we see the MACD maintain its position below the zero line, a clear indication of the dominance of the bears in the market, which is correlated by the histogram, which shows growing bearish activity in the market.
Buy and sell ETH on Remitano
Ripple / US Dollar
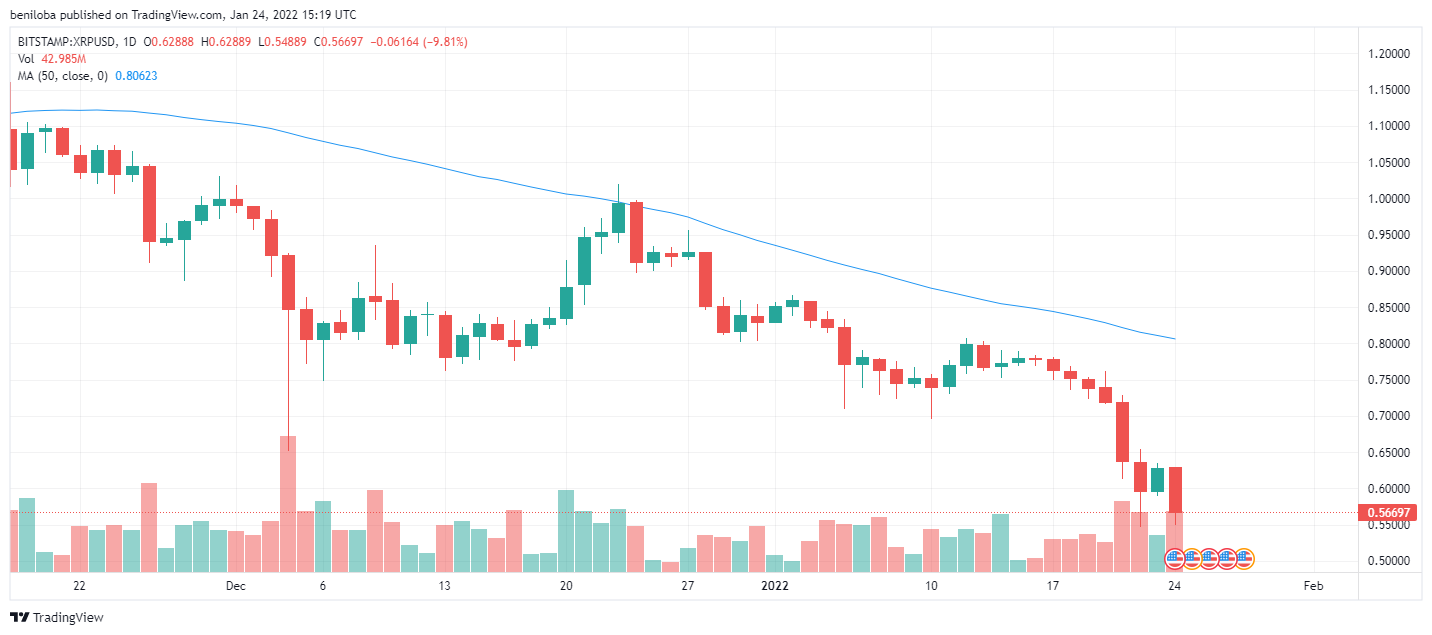
The chart above shows that the bears have a significant hold on the market, with the only significant bullish momentum coming on the 23rd of January. With this bearish action, we see the XRP market continue to trade below its 50-day moving average of 0.806.
With the above statement, we see that the XRP prices on the 22nd, 23rd, and 24th of January stand at $0.596, $0.628, and $0.566, respectively, with the price changes on these days corresponding to -6.38%, +5.30%, and -9.81%, respectively.
As of the writing of this piece, the highest and lowest price points achieved in the market stand at $0.628 and $0.548, respectively.
Indicators

With the current market momentum, we see the XRP market remain in an oversold scenario (a relative strength index below the 30 mark), reflecting the bearish influence on the market. Therefore, the relative strength index over the 22nd, 23rd, and 24th of January stands at 23, 30, and 25, placing the bears in firm control of the market.
The MACD and histogram also correlate to the relative strength index. They are both placed below the zero line and illustrate growing bearish activity, providing a negative outlook for the market.
Buy and sell XRP on Remitano
Litecoin / US Dollar
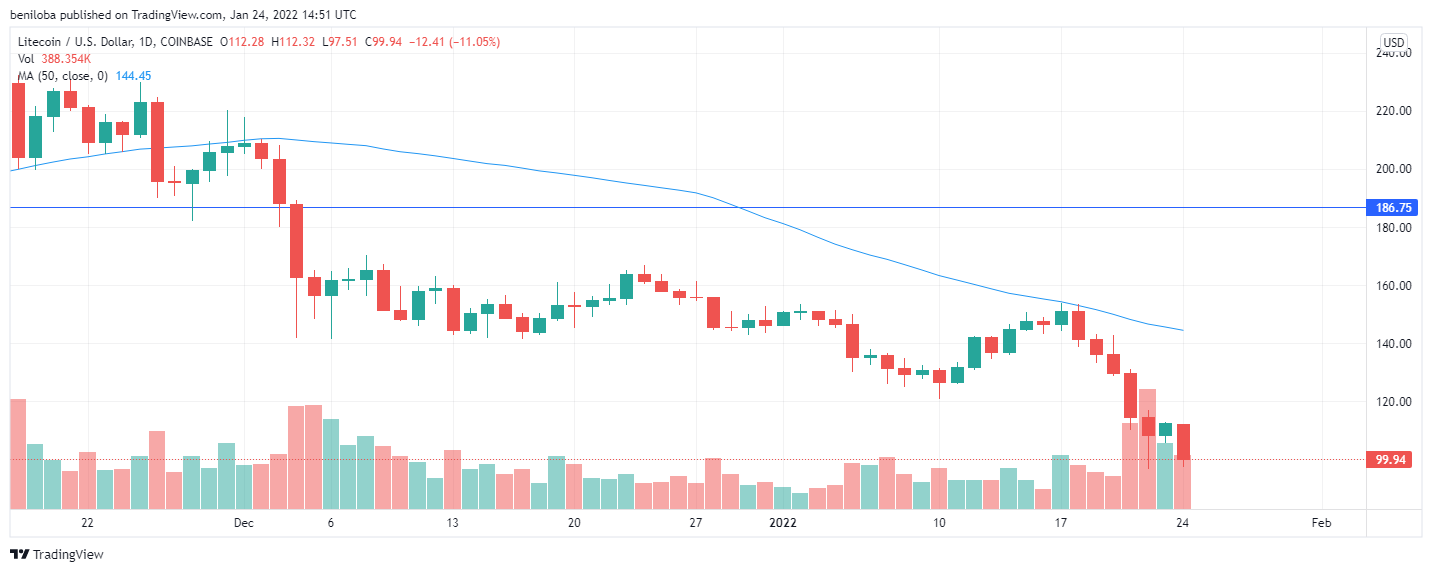
The Litecoin market further trades below its 50-day moving average of $144 per coin as it has experienced dominant bearish action over the last seven days. On the 22nd of January, the LTC market experienced continued bearish action, which saw its price fall by 5.33% to $108 per coin. However, following this dip, the bulls utilized the opportunity to buy into the market, which reflected as a bullish action on the 23rd of January, resulting in a 3.63% increase in the LTC price to $112 per coin.
On the 24th of January, we see the bears attempting to reestablish their previous momentum, and this has already caused an 11.05% drop as of the writing of this piece, bringing the LTC price to $99 per coin. With the market yet to close for the day, we could see more bearish action. Nevertheless, the highest and lowest trading prices achieved so far stand at $112 and $97, respectively.
Indicators

Following sustained bearish action in the litecoin market, we see the relative strength index break below the 30 mark, effectively placing the LTC market in an oversold scenario and, therefore, in bearish control. With the above statement, the RSI on the 22nd, 23rd, and 24th of January stand at 29, 32, and 27, respectively.
In correlation to the relative strength index, we see the MACD and histogram placed below the zero line and show increasing bear activity in the market, portraying a negative outlook.
Buy and Sell LTC on Remitano
Bitcoin Cash / US Dollar
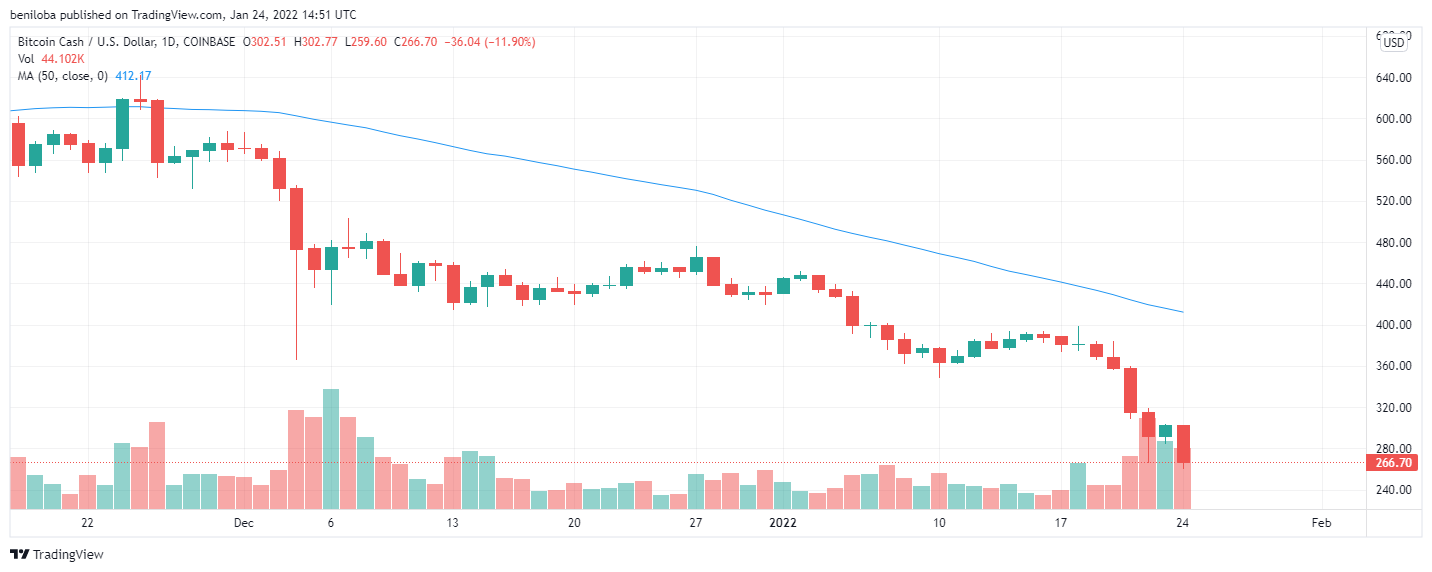
On the 22nd of Janaury, the bears flipped a minute initial bullish push for dominance, establishing the start of their momentum, which saw the Bitcoin Cash price fall by 7.35%, translating to $291 per coin, with the wick below the candle indicating bullish resistance to further price fall. The resistance initiated at the close of the 22nd of January is seen to turn into momentum on the 23rd, influencing a 3.72% increase, bringing the Bitcoin Cash price to $302 per coin. The wick below the candle suggests bullish resistance to an initial bearish action, placing the lowest trading price for the day at $283, while the highest price seen in the market stands at $303 per coin.
On the 24th of January, we see the bears pushing down the Bitcoin Cash price, influencing an 11.90% drop in price to bring the Bitcoin Cash price to $266 per coin. With the market still yet to close, we can expect to see much more volatility. Nevertheless, as of the writing of this piece, the highest and lowest price stands at $302 and $259, respectively.
With the values across the last three days, we see that the Bitcoin Cash market still trades below its 50-day moving average of $412, indicating a downtrend.
Indicators

We see the relative strength index stand below the 30 mark following consecutive bearish actions, effectively placing the Bitcoin Cash market in an oversold scenario. Over the last three days, we see the RSI stand at 19, 25, and 21, effectively placing the BCH market in a bearish grasp.
As a reflection of the bearish activity over the last few days, we see MACD standing below the zero line, indicating bearish dominance. This is correlated by the histogram, which shows increasing bearish activity in the market.
Buy and sell BCH on Remitano
Cardano / US Dollar
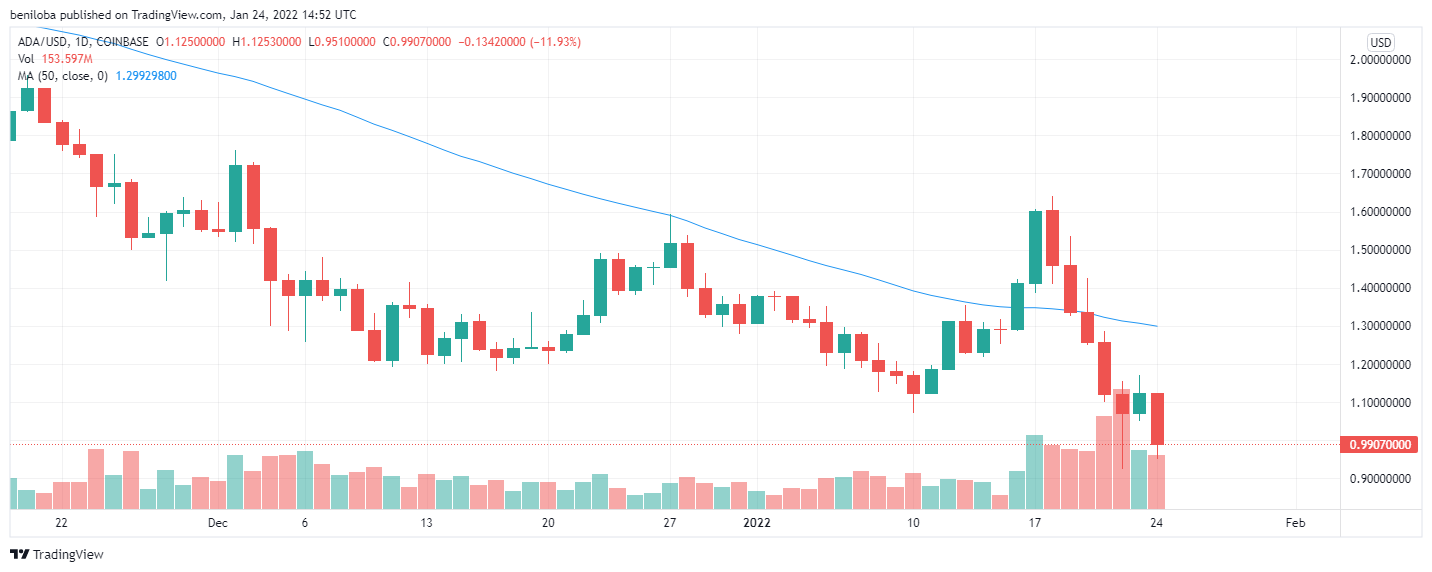
From the above chart, we see that on 22nd January, the bulls initiated a momentum; however, the bears provided sufficient resistance, which flipped the market in favor of the bears. With the above statement, the Bitcoin market fell by 4.44%, translating to $1.07 per coin. The bulls dominated the market on 23rd January following the bearish action, influencing a 5% price growth, bringing it to $1.12 per coin.
On 24th January, the ADA market fell by 11.93%, bringing the ADA market to $0.99 per coin, with the highest and lowest price points seen so far being $1.125 and $0.951, respectively. With the above values being below the ADA market’s 50-day moving average of $1.299, the market can be said to be in a downtrend.
Indicators

The relative strength index stands below the 50 mark, indicating the dominance of bearish selling against bullish buying. With the above, the relative strength index on the 22nd, 23rd, and 24th of January stands at 38, 41, and 37.
The MACD and histogram are placed below the zero line, indicating bearish market dominance; however, the histogram shows increasing bearish presence.
Swap to ADA
Dogecoin / US Dollar

The Dogecoin market trades below its 50-day moving average of $0.167, indicating a clear downtrend. On the 22nd of January, the market sees the bears flip an initial bullish momentum indicated by the wick above the candle to gain control of the market, and then influencing a 6.26%, bringing the Dogecoin price to $0.133 per coin.
On the 23rd of January, we see the bulls influence a gain of 6.38%, bringing the Dogecoin price to $0.141 per coin. The highest and lowest trading prices achieved stand at $0.144 and $0.132, respectively.
Following the bullish action, we see a bearish response on the 24th of January, resulting in an 8.74% drop, bringing the Dogecoin price to $0.129 per coin, with the highest and lowest price points seen in the market at $0.141 and $0.125, respectively.
Indicators
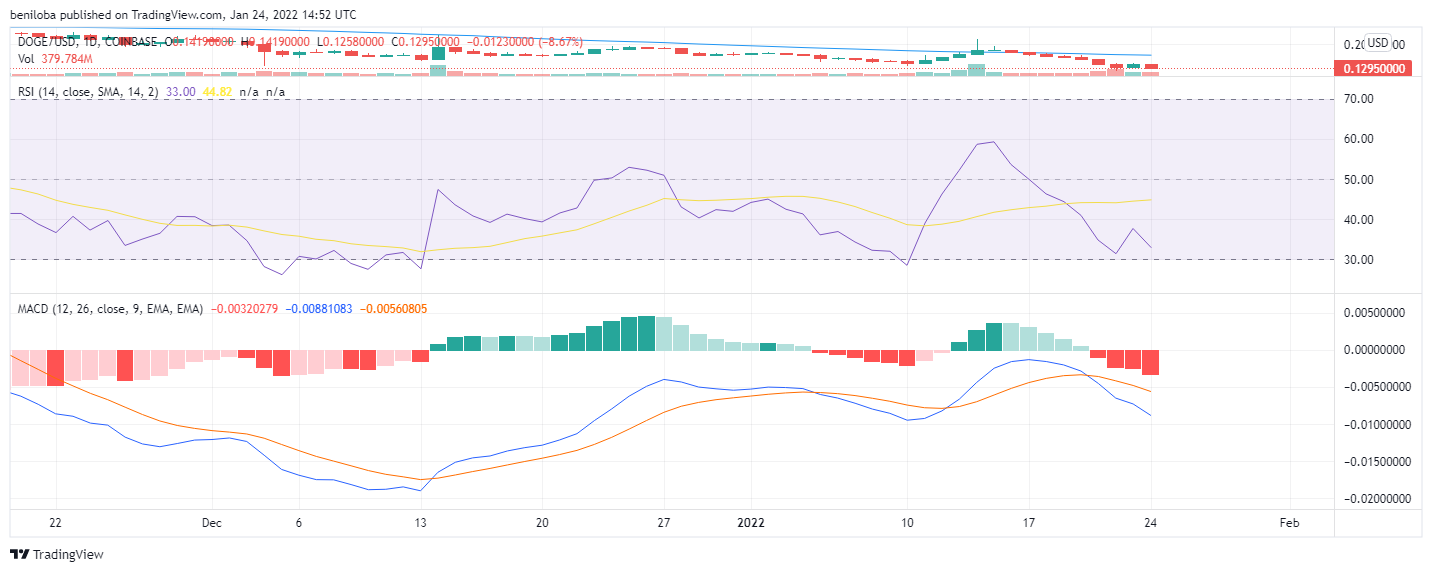
Over the last three days, we see bearish dominance on the RSI chart, indicated by the RSI, trading below the 50 mark with the continued bearish action. With the above statement, the RSI on the 22nd, 23rd, and 24th of January were
The bearish action is reflected on the MACD and histogram by trading below the zero line. The histogram shows increasing bearish activity in the market.
Swap to DOGE
correlations
- Bitcoin / Ethereum = 0.92
- Bitcoin / Ripple = 0.89
- Bitcoin / Litecoin = 0.93
- Bitcoin / Bitcoin cash = 0.90
- Bitcoin / Cardano = 0.88
- Bitcoin / Dogecoin = 0.90
Keynotes for today
- Bitcoin at $33,733 per coin.
- Ethereum at $2,209 per coin.
- Ripple at $0.566 per coin.
- Litecoin at $99 per coin.
- Bitcoin Cash at $266 per coin.
- Cardano at $0.99 per coin.
- Dogecoin at $0.129 per coin.