Bitcoin / US Dollar
Bitcoin's price made a severe correction during the weekend, falling from $41,000 to $33,000. This drop has accumulated a 19 % loss since the all-time high level, indicating that there is a possibility for further correction in the future. We have evidence from previous bullish trends that the price could correct at 40 % before bouncing back and establish a new trend that could drive the price to higher levels.
Given that we have reached a high level above $41,000, a 40 % correction would mean that the price can drop to $24,000! This is something that should not scare us as the previous all-time high level has been around $20,000. It is commonly known that when a price corrects at a price level higher than before, then there is a high probability for another all-time high level in the next period.
If we can say that the bullish market is over, then a bearish trend will probably stop above the $20,000 level and head again to price levels above the $41,000 level. The next days will be crucial for the market to determine if there would be a steep correction in the market that will drive the price at low levels at a fast pace or we would move at a modified correction that will adopt in a bearish market at a slow pace, with small price changes in the meantime.
The trading volumes have been stable at high levels, indicating that the market is on sell-off mode and the bulls will try to cope with this situation. Today's session was volatile as the price reached $32,000 at some time, giving space to the market for more correction in the current situation. The moving averages have been stabilized as we will look at what will happen in the future.
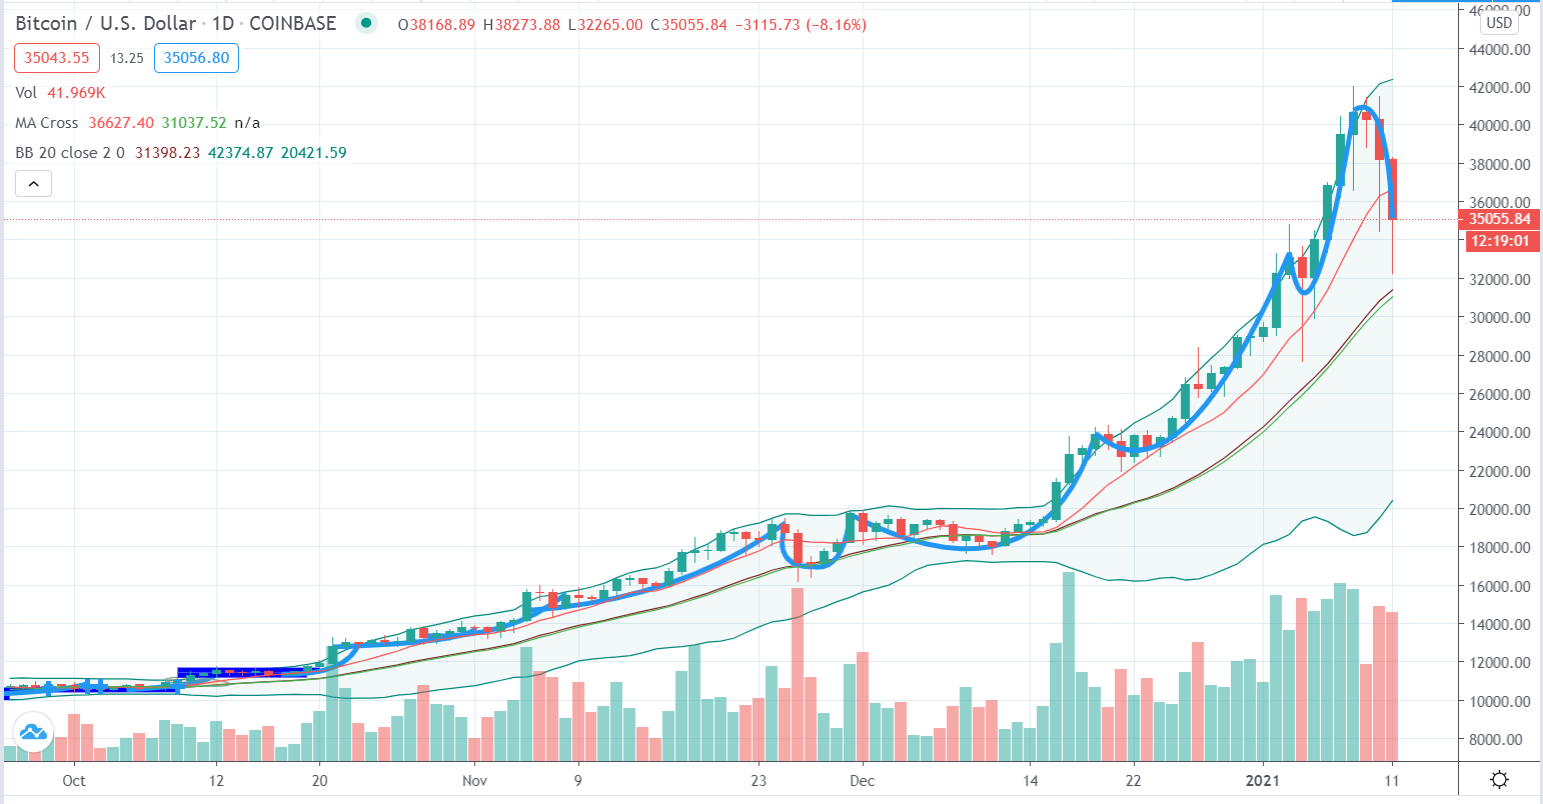
In the short-term diagram, we can observe that there is no holdback as the first minor support level stays around $32,000 while the $24,000 is crucial as there is more market depth created in the market. We saw in the news that some institutional investors have entered the market above the $30,000 level, indicating that the market can bounce back before dropping below $30,000.

Indicators
MACD index moved at lower levels but remained in the positive field, indicating that the correction has been at normal levels for now. The RSI index moved back in the "safe" zone, making the market to stabilize for now.

Ethereum / US Dollar
Ethereum also experienced bearish activity as it followed the trend from Bitcoin, falling from $1,300 to $1,100. This bearish trend won't stop easily in the Ethereum market as the support levels are far from the current price levels.
As we can see from the diagram below, the first minor support level stands around $750 while the major support level lays between $600 and $650, where there are the massive market depth and volume of transactions that drive the price at the current levels. The correction today reached $1,000 and bounced back as the correction was much steeper than expected.
As no all-time high level was reached at this point, we can't say for sure how the market will make a rebound in this case. We believe that a steep corrective trend will stop at the $650 point and then there would be a possibility for another uptrend. The trading volumes remained at high levels, showing that investors are trying to sell their assets while the moving averages have still a major difference between them, showing that there is still a time frame for a trend reversal.

Indicators
MACD index moved at lower values but remained on the positive field, indicating that there is still positivity in the market while the RSI index moved back in the "safe" zone, making the market "green" again for new investments.

Ripple / US Dollar
Ripple is making softer moves in the current situation, as the price fell from $0.30 to $0.28, which is a modest change, taking into consideration that the rest of the market is making severe changes in the market structure.
The liquidity problems could be a benefit at this moment as there is limited capital for Ripple buys and sells. This might be a chance for better results in the correction mode as the fundamentals will fuel the price movements in the next period. We believe that the price will be pegged with the fundamental elements and the issues will be resolved in the future, given that the SEC charges will be settled.
The trading volumes have sustained at normal levels, indicating that the price could be driven from that while the moving averages made a "Golden Cross" in the market, which is a bullish signal but there are low possibilities for the market to create a bullish trend at this moment.

Indicators
MACD index passed on a positive level, without any indicator for further reduction in the situation. The RSI index moved between values 40 and 45, indicating that there is a negative mood in the market that could drive the price at lower levels.

Litecoin / US Dollar
Litecoin's price topped at $180 and the correction was much heavier than other coins, whose drop reached $125, before bouncing back to $140. The minor support level of $160 broke today and it is heading in the next major support level of $130.
The bearish trend will follow the established trend in the market and Bitcoin will affect Litecoin's price direction in the next period. This means that there is a continuous relationship between the two assets that drive the market situation at the current levels.
The trading volumes have remained at high levels, making the market to create a sell-off and drive the price at lower levels while the moving averages have remained at a steady gap between them.

Indicators
MACD index moved in the negative field, indicating that the market momentum passed at negative levels and the market forces will be reversed. The RSI index moved at values between 50 and 55, indicating that there are positive prospects in the current situation.

Bitcoin Cash / US Dollar
Bitcoin Cash made a delayed move in the market as its price corrected one or two days after the major correction in the crypto market. The price topped at $650 while the correction moved back, below $500. The $500 level was a crucial point for the Bitcoin Cash market and indicates that the correction will continue for more.
The first support level in the current situation lays around $440, while the major support zone stays around $360. Those levels show that there is more to be done before passing on a new bullish trend. The trading volumes have made local high levels in the previous days and during the weekend, showing that the Bitcoin sell-off created a gap in the crypto market for needed returns. The moving averages have remained on the same gap between them, indicating that there is more time for a trend reversal.

Indicators
MACD index moved at lower levels but it remained at a positive level while the RSI index moved back in the "safe" zone, landing at value = 60, which is much more positive than the previous period.

Correlations
Bitcoin / Ethereum = 0.96 (+ 0.01), Bitcoin / Ripple = 0.23 (+ 0.64), Bitcoin / Litecoin = 0.94 (- 0.01), Bitcoin / Bitcoin Cash = 0.87 (- 0.05)
The recent drop in the Bitcoin market has coordinated a steady move in the crypto market, showing that the market has been integrated into a similar position and the next moves will be affected by the market leader. Ethereum and Litecoin have been sustained at high levels while Bitcoin Cash has made some moves that don't follow the same positioning for the market direction. On the other hand, Ripple has made a turnover in its direction, moving in the positive correlation zone and creating prospects for returning to the normal conditions of the crypto market.
Key Notes For Today
Bitcoin started to correct to $33,000 during the weekend
Ethereum also corrected around $1,100
Ripple is making stable, bearish moves at $0.28
Litecoin made small negative steps at $140
Bitcoin Cash corrected only today, just below $500
The views and opinions expressed here are solely those of the author and do not necessarily reflect the views of Remitano. Every investment and trading move involves risk, you should conduct your own research when making a decision.





