
In today's news, Bitcoin seems stagnant. What's more?
Let's find out.

In today's news, Bitcoin seems stagnant. What's more?
Let's find out.
After its recent rally to try to break above $35,000, bitcoin price is stuck in a range below the $33,500 and $33,800 resistance levels. It declined past the $32,500 level and settled below the 100 hourly simple moving average.
There was a spike below the $31,000 level, but it remained stable above $30,800.
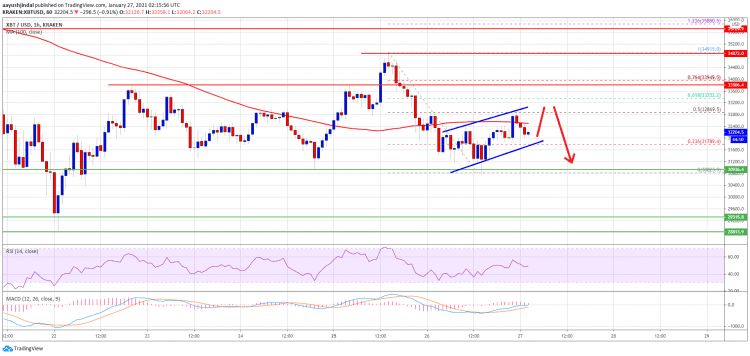
It is currently facing resistance close to the $32,800 zone and the 100 hourly simple moving average. A short-term ascending channel or a bear flag seems to be forming with support near $31,900 on the BTC/USD pair's hourly chart.
If it doesn't clear this level, the next crucial support awaits at the $30,800 zone. Further losses beyond that mean we could see a downside break below the $30,000 support zone.
In conclusion, Bitcoin, although it seems bearish, we might see support hold in crucial levels just like some days ago. Same with ethereum, there might even be a greater chance of ethereum rallying and taking off to possible new ATH after this correction.
Ethereum hit the $1,250 support level, after which it started a new increase. It broke the $1,300, $1,320, and $1,350 resistance levels and even the 100 hourly simple moving average. It formed a high near $1,375, but the price is currently falling. The fulls weren't able to defend the price above $1,350.
A critical bearish trend line seems to be forming with resistance near $1,360 on the ETH/USD pair's hourly chart. If it breaks to the downside, immediate support is near the $1,295 level.
After that, the next significant support is near the $1,250 station. Below this, we could see ethereum continuing down towards the $1,200 or even $1,180 support level.
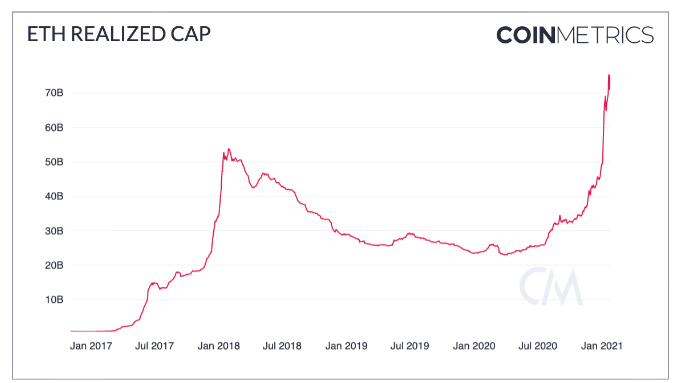
Also, Ethereum's realized capitalization has seen a 50% increase in just January of this year alone.
The realized cap has tripled since March 2020 and currently sits at over $70 billion. Realized cap indicates when new capital is flowing into a given market.
According to CoinMetrics, this means that demand continues to grow as many new investors may have been purchasing the bags of seasoned ETH whales during January's bull market.
Ethereum appears to have outperformed Bitcoin as CoinMetrics' data shows that BTC's realized cap had grown 50% since the beginning of 2020 as of Dec. 15. Compared to that of Ethereum, which had seen an 85% increase over the same period.
See which altcoin is ahead today.
Bitcoin cash price is down over 5%, and it broke the USD 405 and USD 400 support levels. BCH shows bearish signs, but it might find bids near the USD 388 and USD 385 levels.
The next major support is near the USD 365 level. On the upside, the bulls need to gain strength above USD 405 for a fresh increase.
Litecoin (LTC) declined over 5%, and it is trading well below USD 130 level. LTC is testing the USD 125 support level, and it might continue to move down.
The next major support sits at USD 112, below which the price could revisit the USD 105 support. On the upside, the USD 132 and USD 135 levels could prevent a strong recovery.
XRP price is gaining bearish momentum below the USD 0.265 level. It even broke USD 0.255, and it seems like the bears are aiming for a larger decline.
The next major support is near the USD 0.220 level, below which the price may even revisit USD 0.200. On the upside, the price might struggle near USD 0.280.



