On the 17th of February, the bears continued their bearish momentum from the previous day as indicated by the candle formation after flipping an initial bullish momentum as indicated by the wick above the candle, which denotes the highest trading price of Bitcoin of the day at $44,195 per coin. With the successful bearish start to the market, the bears influenced a massive 7.65% drop in the Bitcoin price, bringing the price of each coin to $40,536. The chart also illustrates the bullish rejection of further bearish action at the start of the day, indicated by the wick below the candle and placing the lowest price of Bitcoin for the day at $40,099 per coin.
At the start of the 18th of February, we see a bearish start to the market, a continuation of the bearish action of the previous day. From the above chart, we see increased selling volumes, resulting in a bearish dominance of the market at its start; however, with noted bullish resistance, the loss seen on this day is so far limited to 0.68%, bringing the Bitcoin price to $40,261 per coin. With this move, the bears lead the market, but we could see a shift in the market momentum with so much time left. Nevertheless, as at the writing of this piece, the highest and lowest Bitcoin trading price for the day stands at $40,099 and $40,121, respectively.
Indicators

With the bearish action seen over the last two days, the Bitcoin market has fallen into bearish territory, as indicated by the relative strength index below the 50 mark. On the 17th of February, the bearish action resulted in a fall of the RSI to 45.45. With the sustained bearish start to the 18th of February, we see the relative strength index fall to 44.50, reflecting the bears maintaining control of the market.
With the bearish action, the histogram has shifted into the bearish zone (below the zero line). In correlation with other indicators, the MACD places above the zero line, indicating a positive outcome for the asset. However, the bearish action sees the MACD deflect towards the zero line, below which confirms bearish dominance of the market.
Buy and sell BTC on Remitano
Ethereum / US Dollar

As with the Bitcoin market, we see the Ethereum market experience massive bearish action on the 17th of February, resulting in the market falling below its 50-day moving average of $3,038, placing the market in bearish favor. With the bearish move on this day, the bears influenced a 7.39% drop, placing the ETH price at $2,893 per coin in a move that gained the bears market control following a successful takeover from the bulls as indicated by the wick above the candle, denoting the highest and lowest trading price point for the day at $3,162 and $2,853, respectively.
Following the bearish action of the previous day, we see the bulls attempting to revive the ETH market on the 18th of February in an attempt to get the market back above its 50-day average. The ETH price is up 0.25% with this move, translating to $2,900 per coin. With the market still far from its close, we expect to see more activity, subjecting values seen during the day to change. Nevertheless, as at the writing of this piece, the highest and lowest ETH trading prices for the day stand at $2,945 and $2,863, respectively.
Indicators

With the bullish action on the 17th of February, the relative strength index has fallen to 46.87, reflecting increased selling action on the day. With the bulls attempting to revive the market on the 18th of February, we see the relative strength index stop its descent, flattening out and standing at 47.11. With the bearish action over the last two days, the ETH market has fallen in bearish territory, as indicated by the values over the last two days standing below the 50 mark.
In correlation to the relative strength index, the histogram and MACD show significant bearish action though remaining bullish as they stand above the zero line maintaining the positive outlook for the asset.
Buy and sell ETH on Remitano
Ripple / US Dollar

The above chart shows that the Ripple market has experienced bearish action on the 17th, as with several other assets. On the 17th of February, the bears initiated a move, continuing the consecutive bearish action over the previous days. The Ripple market fell by 8.42%, bringing the XRP value to $0.767 per coin with their momentum. The wick below the candle indicates bullish rejection of bearish downward action in the market, placing the lowest XRP trading price for the day at $0.754 per coin, while the highest trading price for the day stands at $0.845 per coin.
We see the bulls establishing their momentum in maintaining the Ripple market above its 50-day moving average by influencing a 1.71% rise in the XRP price at the start of the 18th of February, bringing the XRP price to $0.780 per coin. The wick above the candle suggests bearish rejection to an initial bullish action, and with the market far from its close for the day, we could see more action, which might see the bulls lose their grasp on the market. Nevertheless, as at the writing of this piece, the highest and lowest XRP trading prices achieved so far stand at $0.804 and $0.764, respectively.
Despite the bearish action seen on the 17th, the Ripple market remains bullish as it trades well above its 50-day moving average.
Indicators
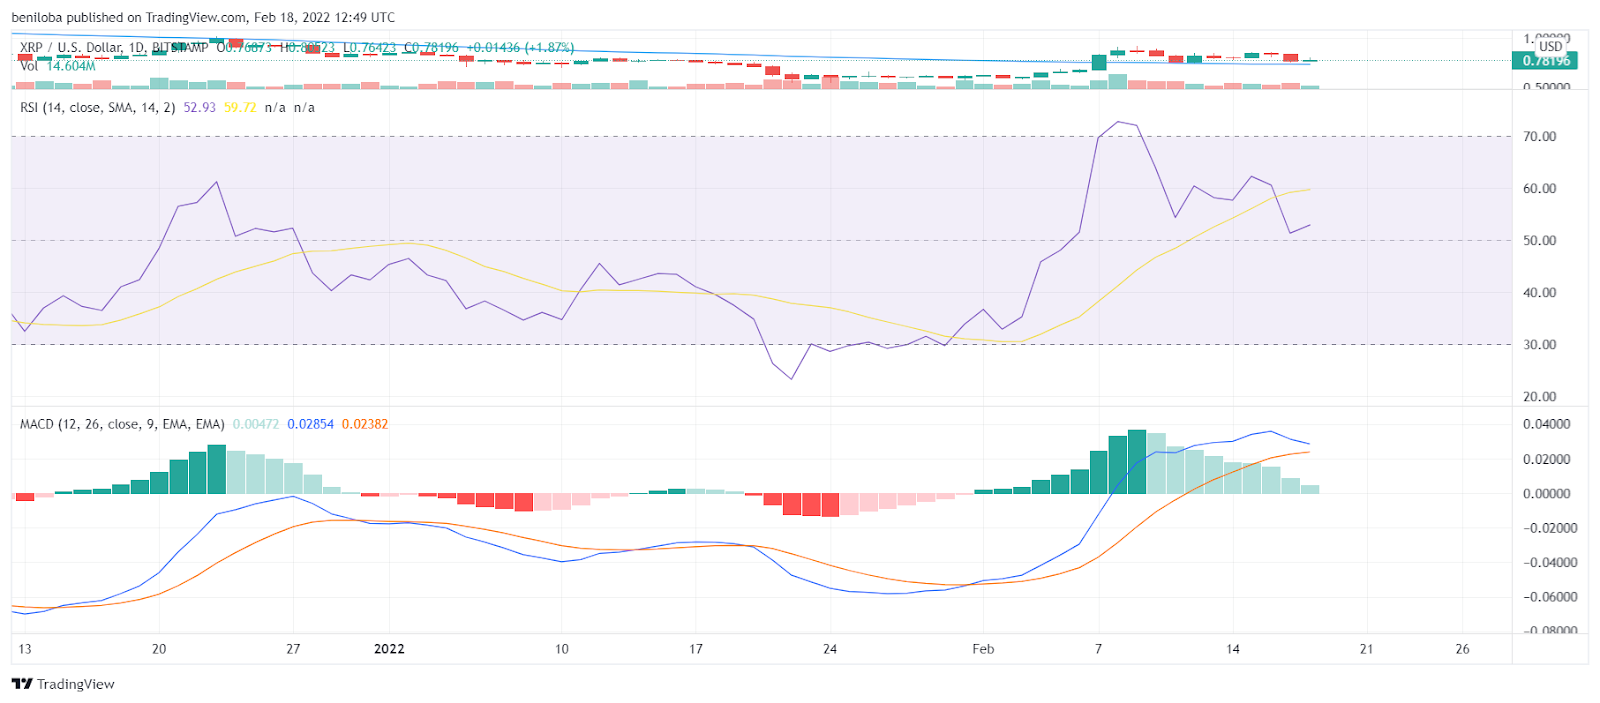
With the bearish action on the 17th, the Ripple relative strength index is down to 51.36. However, the Ripple market remains bullish despite this bearish action, as indicated by the relative strength index above the 50 mark. On the 18th of February, the bullish action resulted in a rise of the RSI to 52.93. The histogram remains bullish; however, we see reduced bullish activity on the 17th and 18th of February. In correlation with other indicators, the MACD places above the zero line, indicating a positive outcome for the asset.
Buy and sell XRP on Remitano
Litecoin / US Dollar

The above chart shows that the Litecoin market remains below its 50-day moving average of $127. On the 17th of February, the bears continued their action of the previous day, resulting in a momentum that has kept the market in bearish downtrend. The LTC market dropped by 8.96%, bringing the LTC value to $116 per coin with their momentum. The wick below the candle indicates the lowest LTC trading price for the day at $114 per coin, while the highest trading price for the day stands at $129 per coin.
We see the bulls establishing their effort in bringing the LTC market back in the positive in an attempt to bring the market back above its 50-day moving average of $127 per coin by influencing a 2.70% increase in the LTC price at the start of the 18th of February, bringing the LTC price to $119 per coin.
The wick below the candle suggests bullish rejection to further price fall before flipping the market in their favor, and with the market far from its close for the day, we could see more action, which might see the bulls lose their grasp on the market. Nevertheless, as at the writing of this piece, the highest and lowest LTC trading prices achieved so far at $123 and $115, respectively.
Indicators

Due to the bearish action in the Litecoin market on the 17th, we see the relative strength index of Litecoin fall but rise due to the bullish action of the next day. With this move, the Litecoin market has fallen into the bearish zone, as indicated by the relative strength index below the 50 mark. On the 17th of February, the bearish action resulted in a fall of the RSI to 42.74. With the sustained but contested bullish start to the 18th of February, we see the relative strength index rise to 45.40, reflecting the bears struggling to gain market control.
The histogram has fallen into bearish territory together with the MACD, indicating a slight bearish dominance over the market.
Buy and Sell LTC on Remitano
Bitcoin Cash / US Dollar
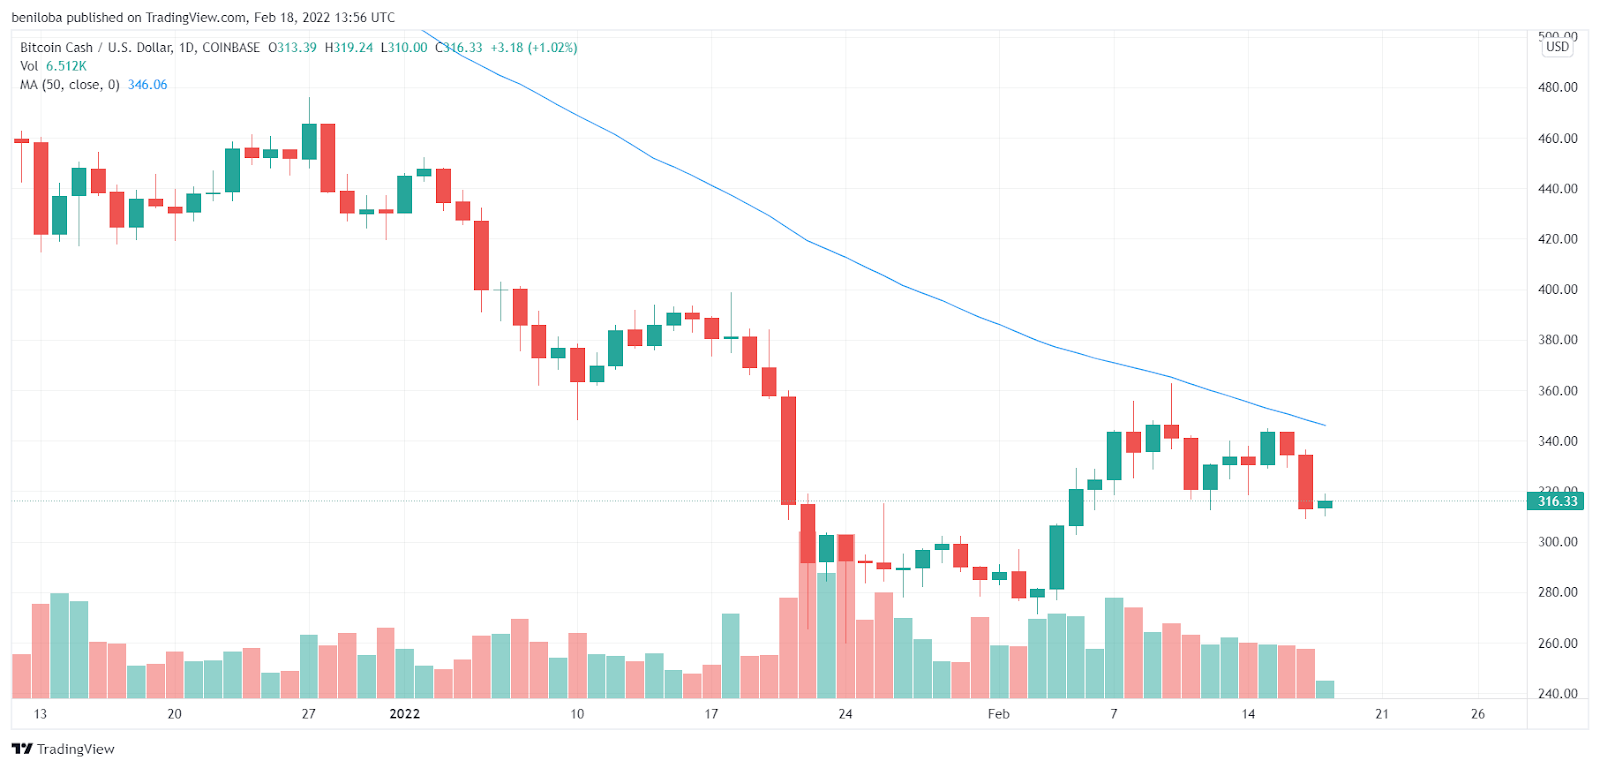
As with most of the crypto market, the Bitcoin Cash market has experienced bearish activity on the 17th, further falltering the market's progress toward its 50-day moving average of $346.
On the 17th of February, the bears initiated a momentum resulting in a 6.40% decrease in the Bitcoin Cash price to $313 per coin as indicated by the formation of the red candle for the respective day, the highest trading price of BCH of the day stands at $336 per coin. The wick below the candle indicates the lowest price of Bitcoin Cash for the day at $308 per coin.
At the start of the 18th of February, we see the bulls initiating a response to the previous bearish action of the 17th. However, with bearish resistance, the gain seen on this day is so far limited to 1.02%, bringing the Bitcoin Cash price to $316 per coin. With this move, the bulls lead the market, but we could see a shift in the market momentum with so much time left. Nevertheless, as at the writing of this piece, the highest and lowest Bitcoin Cash trading price for the day stands at $319 and $310, respectively.
Indicators
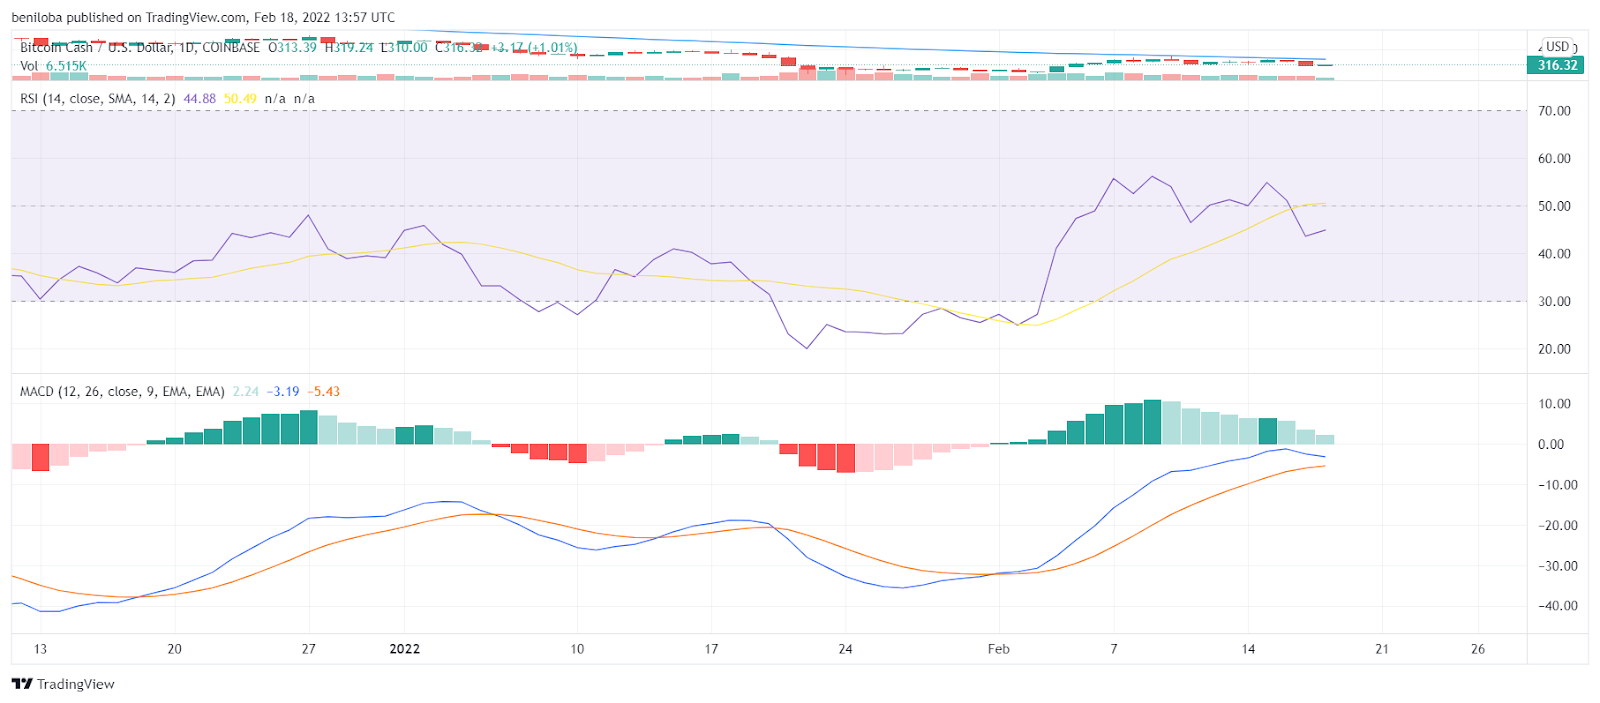
On the 17th of February, the bearish action resulted in a fall of the relative strength index to 43.59. With the bullish start to the 18th of February, we see the relative strength index rise to 44.88, reflecting the bulls struggling to gain market control.
With the price action over the last two days, the Bitcoin Cash market has fallen into the bearish zone, as indicated by the relative strength index below the 50 mark.
The histogram remains bullish; however, we see decreased bullish activity on the 17th and 18th of February. In correlation with other indicators, the MACD deflects further away from the zero line, indicating a negative outcome for the asset.
Buy and sell BCH on Remitano
Cardano / US Dollar
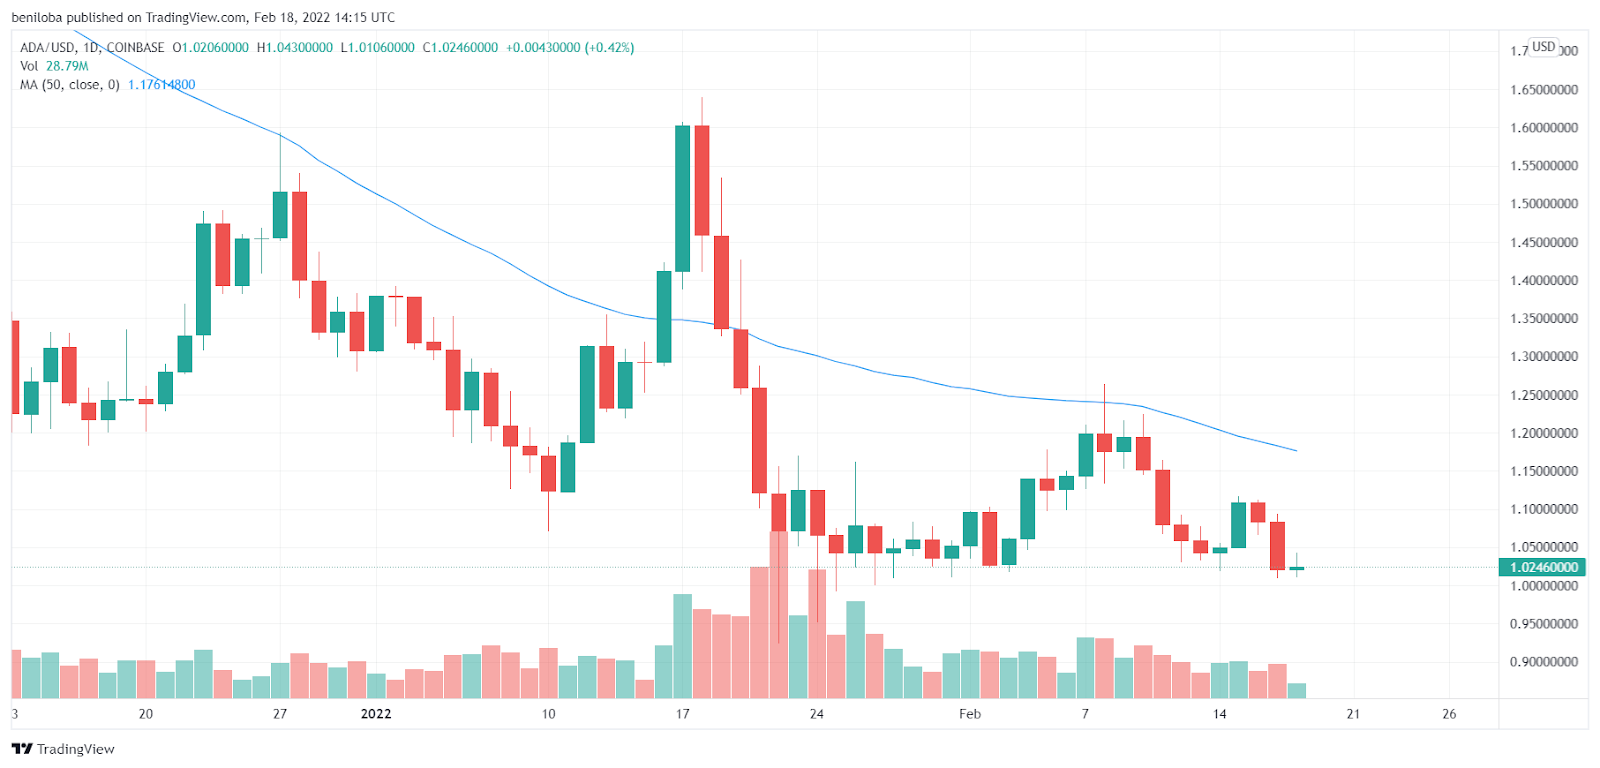
The ADA market remains below its 50-day moving average of $1.176 per coin, suggesting a market yet to break out of its downtrend. On the 17th of February, the bears continued their previous momentum, resulting in a 5.82% drop, bringing the ADA price to $1.020 per coin, while the highest trading price of ADA stood at $1.094 per coin. We see the bulls initiating a move after rejecting an initial bearish momentum following the previous bearish day. With the market still hours from its close for the day, the market is likely to be more volatile; however, as at the writing of this piece, the ADA market is up by 0.42%, translating to a price of $1.024 per coin on the 18th of February.
Indicators
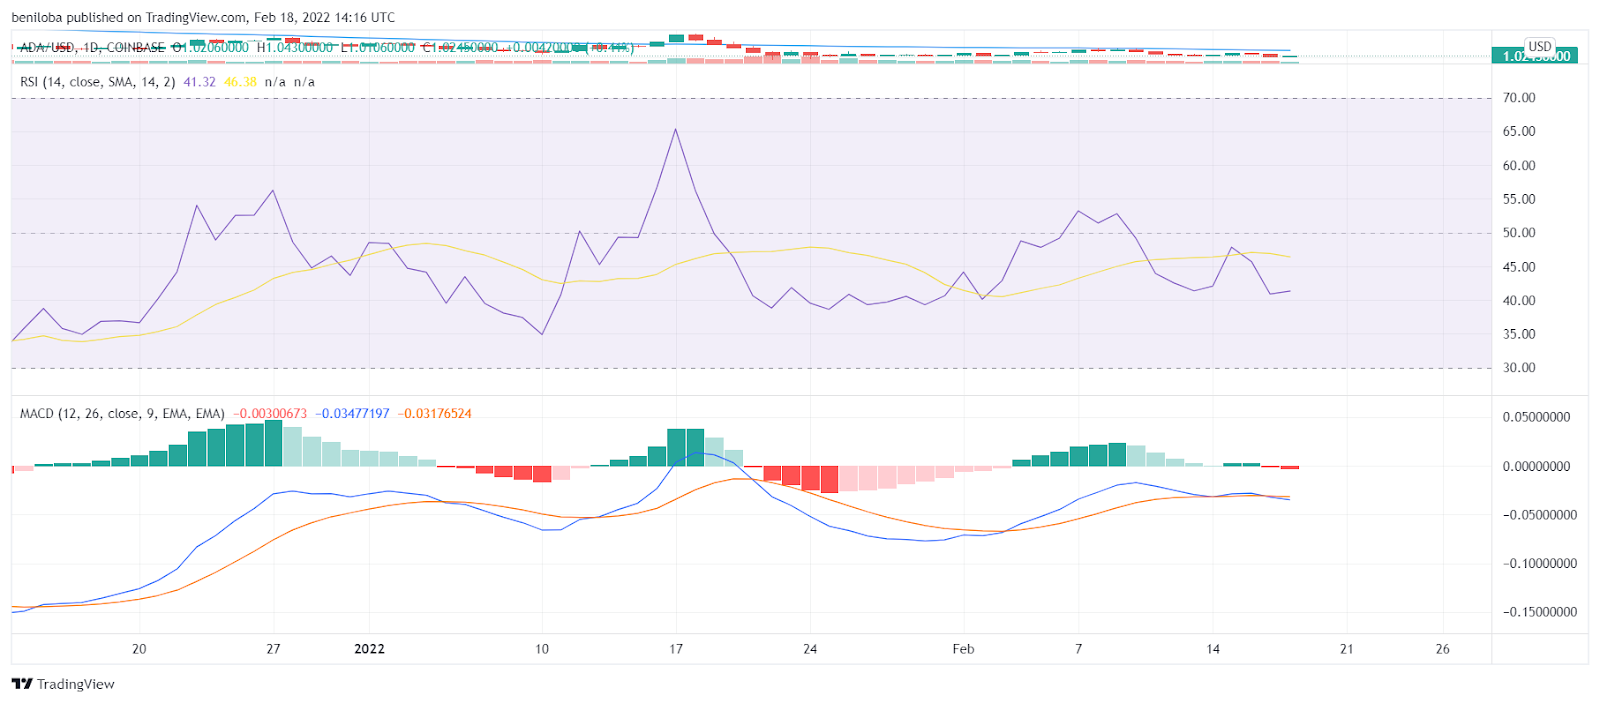
With the ADA bulls unable to establish a full momentum, the relative strength index over the last two days trades well below the 50 mark, at 40.88 on the 17th of February, and 41.32 on the 18th of February, indicating the bears maintain a hold on the momentum.
The MACD and histogram portray a market now within bearish control due to the bearish dominance over the last few days, creating a negative outlook for the asset.
Swap to ADA
Dogecoin / US Dollar
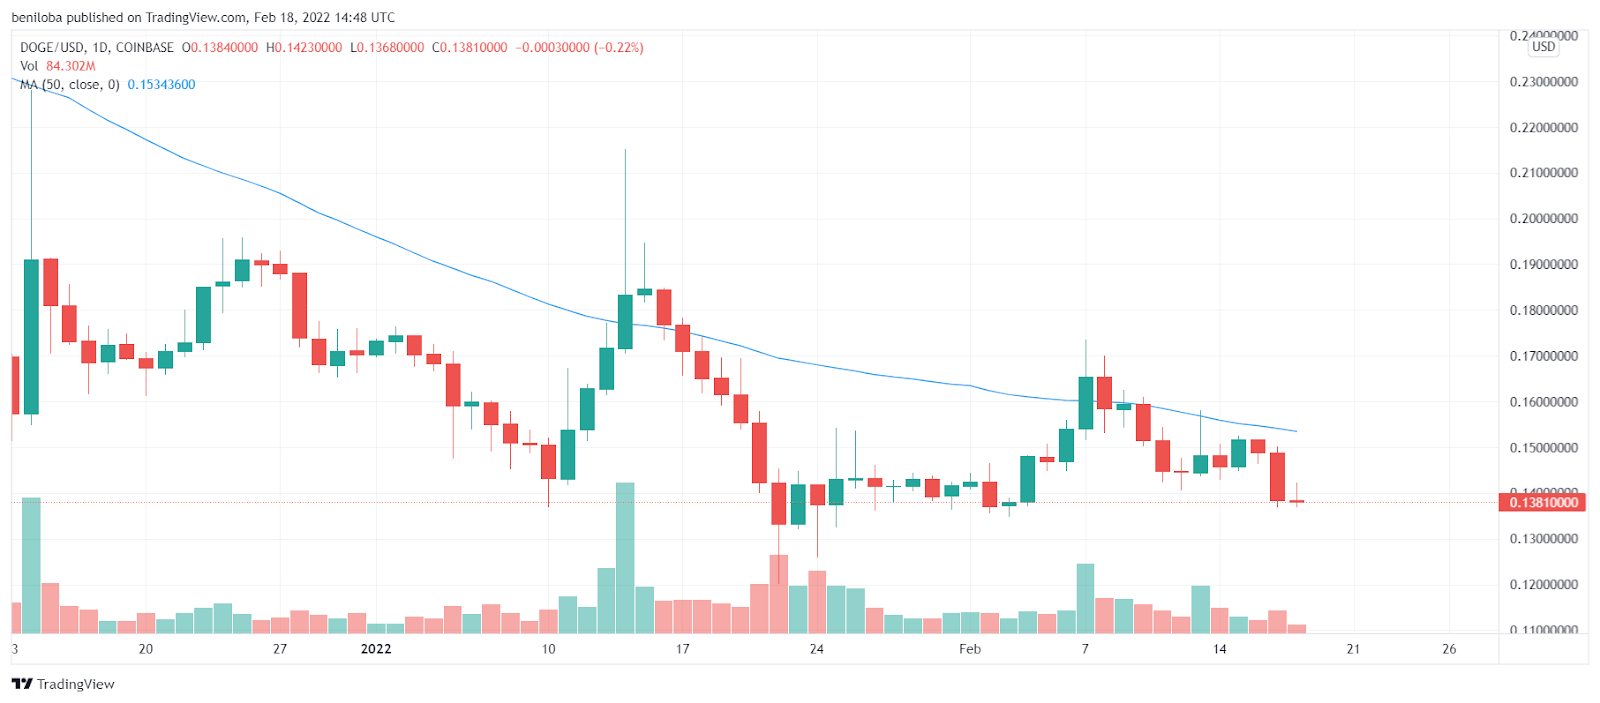
The Dogecoin market remains below its 50-day moving average of $0.153 per coin, suggesting a market yet to break out of its downtrend. The bears continued their momentum on the 17th and 18th of February, resulting in a 6.99% and 0.22% drop on these days, bringing the DOGE price to $0.1384 and $0.1381 on these respective days. With the market still hours from its close on the 18th of February, the market is likely to be more volatile.
Indicators

Due to the bearish action over the last two days, we see consecutive fall in the relative strength index, standing at 41.28 and 40.85 on the 17th and 18th of February, respectively.
The MACD and histogram falls slightly below the zero line, indicating bearish dominance of the market.
Swap to DOGE
Correlations
- Bitcoin / Ethereum = 0.93
- Bitcoin / Ripple = 0.89
- Bitcoin / Litecoin = 0.75
- Bitcoin / Bitcoin cash = 0.87
- Bitcoin / Cardano = 0.90
- Bitcoin / Dogecoin = 0.91
Keynotes for today
- Bitcoin at $40,261 per coin.
- Ethereum at $2,900 per coin.
- Ripple at $0.780 per coin.
- Litecoin at $119 per coin.
- Bitcoin Cash at $316 per coin.
- Cardano at $1.024 per coin.
- Dogecoin at $0.138 per coin.





