BTC/USD
BTC has dipped by 6% last week and is presently fighting to stay over $32K. Ever since the second week of May capitulation candle, the major crypto has been trading in a protracted period of consolidation between $30K and $40.5K, and between $30K and $35K for the last month.
On the daily chart, this consolidation can be viewed as a bearish trendline, as seen below. However, if there can be a breakout from the lower resistance in the upward direction, we expect the giant pair to be trading around the $40k region.

This week's low sits inside the same support line – $31K from Friday – as it did in previous weeks when BTC tested the $30-31K lows. Since May, this key range has aided the market on many occasions. As a result, it will be critical to defending to avoid a drop below $30,000.
In terms of technical analysis, the Bollinger Bands are quite tight, and the volume is dropping. From a fundamental standpoint, the market expects the Grayscale Bitcoin Trust unlocking event to begin today, July 19th.
Since the beginning of June, BTC has been trading in a falling price channel. On Friday, it found support and rebounded from there to test $32,300 resistance.
Since June, Bitcoin has repaired the weekly candle by monumental price gains on Sundays, leaving a lengthy wick down. It remains to be seen whether this Sunday will follow the same pattern.
In the near term, the initial support level is seen at $31,700, which is the base angle of such a near-term ascending price channel. A crucial support region follows this in the $30-31K level, which is the triangle's lower border.
If $30K is broken, the other support level is $29,400 (1.272 Fib Extension on the downside), followed by $28.6K, which was June's BTCUSD low.
On the other hand, The initial barrier is located between $32,300 (short-term resistance) and $32,700. (upper angle of the triangle). This is followed by $33.5K (higher angle of the descending price channel and 20-day MA), $35,000 (50-day MA), and $36,600 (lower angle of the descending price channel and 20-day MA) (late-June highs).
The daily RSI has been below the median and underneath the long-term declining trend line (blue line) since February, preventing momentum from establishing a higher high. If this blue line breaks, it means that the momentum is now poised to pick up on a longer-term basis.
Indicators
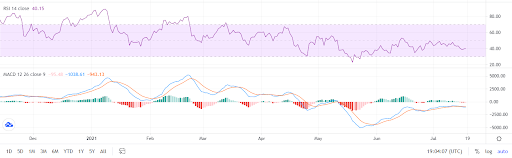
The RSI indicator has been hovering at the 40% mark, making many investors use a horizontal trendline. This is not encouraging since the curve has dropped from previous levels, indicating further bearish conditions.
The MACD signal has been negative for a while now, with a high degree of consistency as seen with the histogram height and curves interlocking one another.
ETH/USD
After pumping to the $1994.40 region, marking a challenge of the 23.6 percent Fibonacci retracement of the depreciating range from $2411.19 to $1865.67, ETHUSD attempted to defend some significant gains by seeking another bid over the psychologically important $1900 level. During its ascent, the pair challenged the 50-bar, 4-hour simple moving average, and strong upward pressure-formed around the 50-hour simple moving average. According to analysts, the intraday high was also a test of the $1994.44 level, which represents the 76.4 percent Fibonacci retracement of the depreciating range from $2039.99 to $1847.

During the current dip, stops were set below the $2064.30 - $1868.97 levels. If the current advances in ETHUSD are not sustained, negative price targets include the $1588 - $1155 levels.
According to traders, the 50-bar moving average is bearishly suggesting below the 100-bar moving average and underneath the 200-bar moving average. Furthermore, the 50-bar moving average is bearishly signaling a move below the 100-bar moving average and the 200-bar moving average.
The 50-bar moving average at $1990.76 and the 100-bar moving average at $1929.36 are the closest price levels.
Stops are predicted below 1700/ 1633.51/ 1456.03. Technical Support is expected around 1700/ 1633.51/ 1456.03. Around $3122.22 - $3788.66, technical resistance is anticipated, with hindrances predicted higher.
Indicators
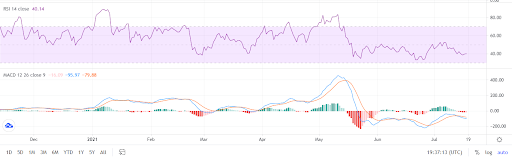
The RSI indicator for ETHUSD is hovering around 46%, confirming the negative trend that has been in place for some time.
The MACD for ETHUSD is slowly gaining pace in the bearish zone, with the curves at variance with one another, owing to a high level of inconsistency.
XRP/USD
The price of XRPUSD was volatile during the previous seven months since the ongoing SEC litigation had a great impact on the price of XRP. Looking at the price chart, we can see how the price of XRP has been in a downward trend for over two months. Price has repeatedly refused the highest trend throughout this period, as bulls cannot break away.
XRP is attempting to breach the top trend line in its downwards channel at the time of writing. If successful, XRP price has to remove its 125 moveable average that has been an obstacle for about 60 days.

When bears dominate and refuse to do so, and the price dips, they will receive their present support of $0.589 or experience a decrease in their level. The next XRP support is $0.538, the final important support for $0.40. This is likely if BTC does not maintain its $30,000 level of support.
When we examine the RSI, we find that it bounced below 50 again and again. A clean break from 50 is anticipated to rocket XRP at about $0.634 straight up to its biggest barrier. The MACD offers a similar narrative as it consolidated under the 0 line waiting for a positive break.
Indicators
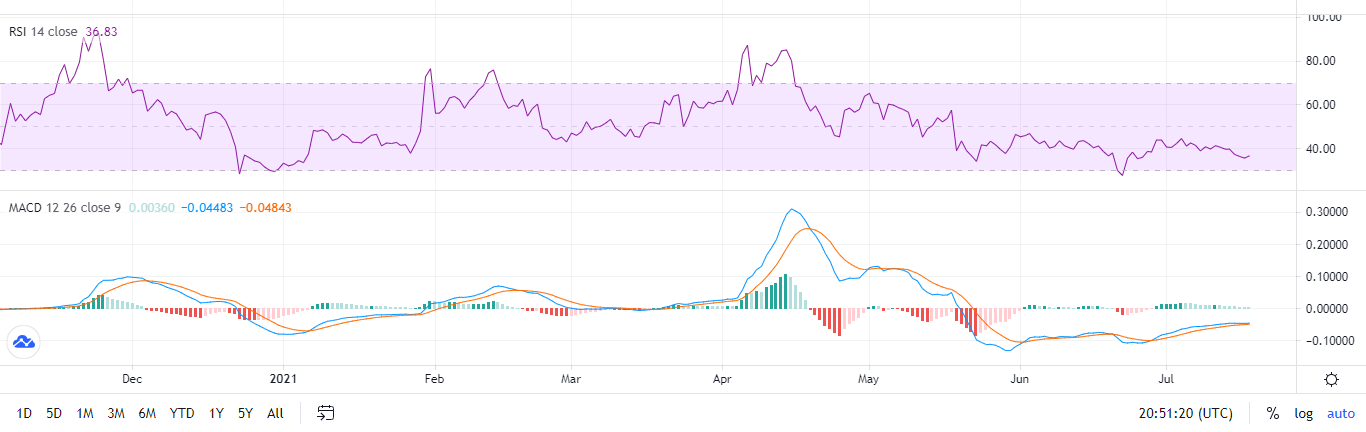
The RSI index is still around 36, which is offering the hodlers little or no hope. The MACD signal is very close to the positive region, meaning that the market is primed to take a pump in the coming weeks.
LTC/USD
About four days ago, LTCUSD bounced back the $118 support at the downtrend on July 15th. That indicates the bears are fiercely protecting the downward trend.
The downhill averages and the RSI below 36 indicate that it is down to a less resistant decline. The LTCUSD pair might fall to the $104.92 to $100 supported zone if the bears fall and keep their prices below $118.
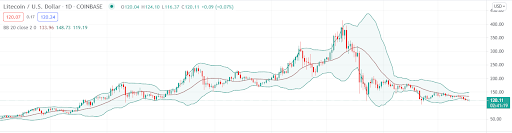
The area might draw buyers, but if bulls do not get the price back over 118 dollars, sales could continue. A break of less than $100 may extend the fall to the following 70 dollars. If the price rebels above the present level and breaks over the downward line, this pessimistic perspective will disappear.
Indicators
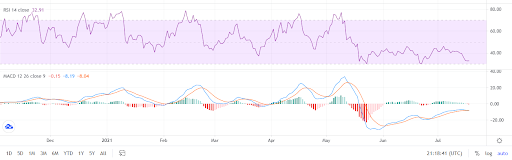
The RSI index to the 32% mark casting trepidation in the minds of investors. The negative MACD signals a bearish divergence, and this will consequently cause a price decrease.
BCH/USD
In the wake of the bulls attempting to push BCHUSD back over $475.69, but did not. This indicates that bears have turned to resistance at $475.69. Few days ago, the pair reversed.
A little amount of $428 is available. The torrents will push the BCHUSD pair upwards to $475,69 once more if the price rises above this level. The pair may go up to $538.11 if it succeeds. A breakdown of the resistance shows probable trend shifts.
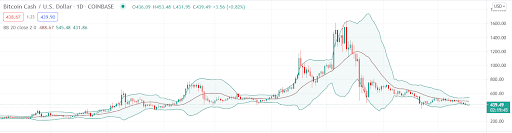
If the price goes down and falls below $428, the pair might fall at $400 and then $370 on the psychological threshold. The decreasing moving averages and the RSI below 36 are indicative of control by the bears. The second phase of the decline may begin with a breach below $370.
Indicators

The RSI index is presently around 35 and shows that the price will continue to be the same for the next few days. The MACD is negative and shows that the market is currently bearish.
Correlations
- Bitcoin / Ethereum = 0.83
- Bitcoin / Ripple = 0.81
- Bitcoin / Litecoin = 0.89
- Bitcoin / Bitcoin Cash = 0.80
There is still a strong correlation between BTC and the rest of the market, as every other asset has. This means that the success of Bitcoin will have a ricochet effect on the market in general. There is a correlation there, but the underlying trend of decline is still there when viewing total ETH locked or BTC locked.
Over the previous several weeks, cryptocurrencies like XRP and LTC have formed a strong connection with BTC. This means that if a positive trend emerges shortly, the market will almost certainly continue in the same way. As a result of the compression, we expect the correlation field to rise even more in the following days.
Key Notes for Today
- Bitcoin has repaired the weekly candle by monumental price gains on Sundays, leaving a lengthy wick down.
- ETHUSD attempted to defend some significant gains by seeking another bid over the psychologically important $1900 level. The price of XRPUSD was volatile during the previous seven months since the ongoing SEC litigation had a great impact on the price of XRP.





