Since December 31, 2022, Remitano Swap has made changes to the candlestick chart and given users easy-to-use tools for analyzing btc usd chart and other coin pair chart.
Currently we only support candlestick charts on website and Android phones, the chart viewing feature on Ios version will be updated as soon as possible.
Instructions for viewing candlestick charts on Remitano interface
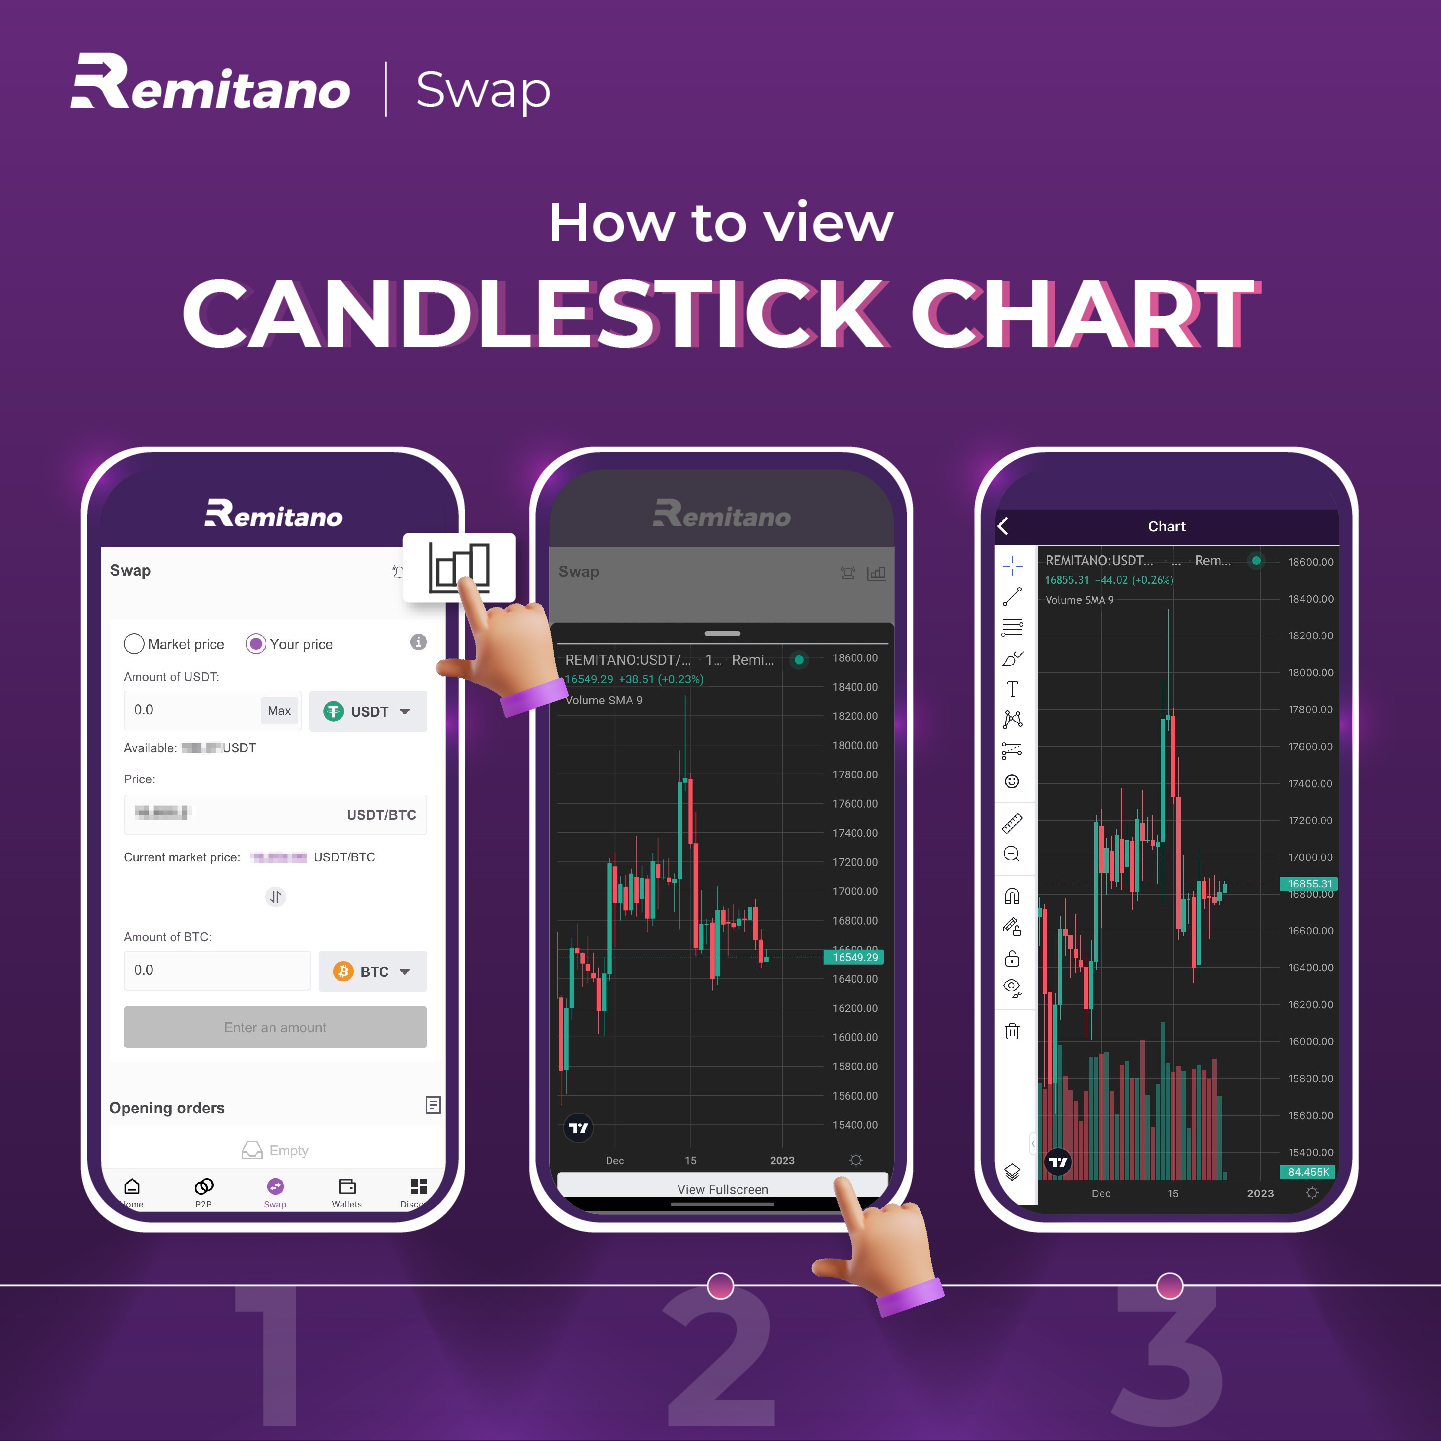
Step 1: On Swap interface, select the asset pair you want to see the price, then click the "Chart" icon at the right corner of the screen.
Step 2: Click "View full screen" to switch to full screen view
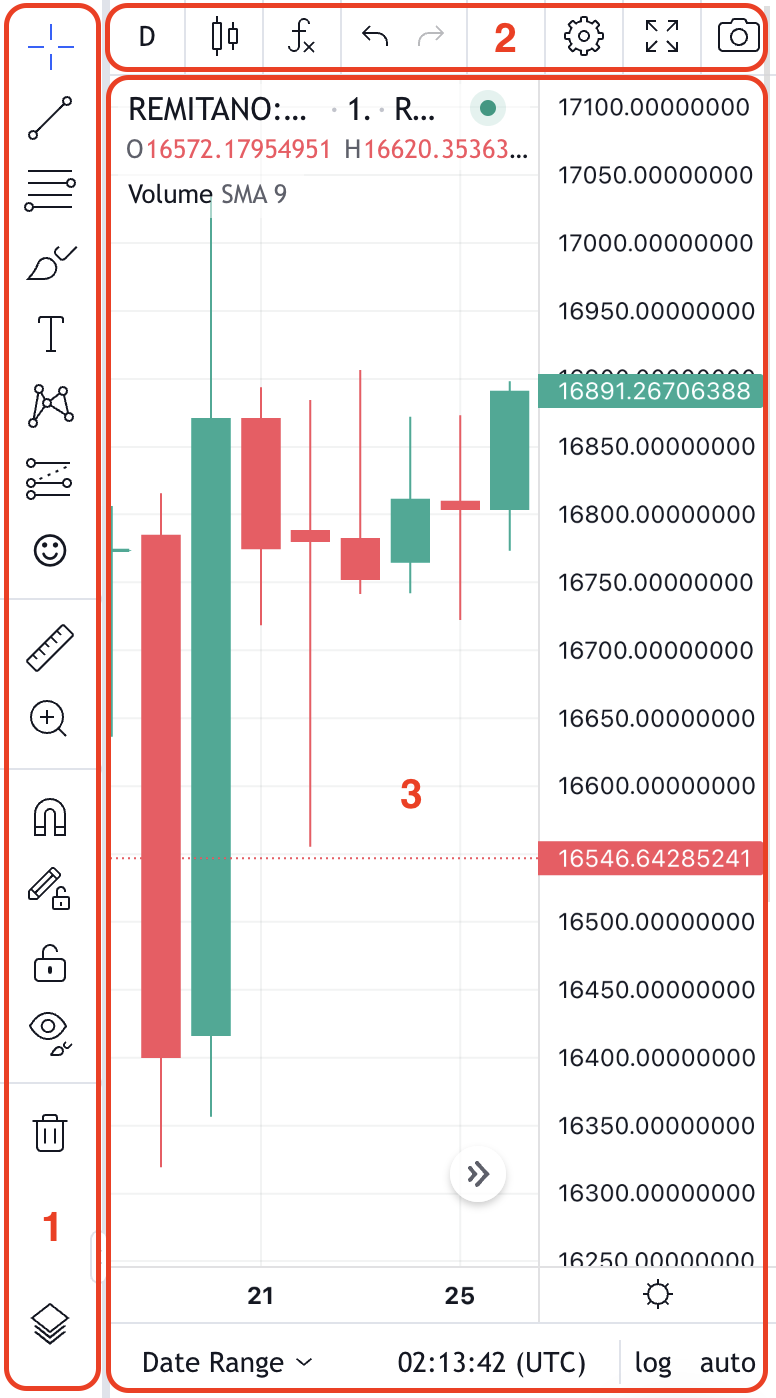
Structure of Remitano's chart section
Part 1: The left toolbar contains all the drawing and measuring tools. However, you need to study and understand technical analysis to use these tools proficiently.
Part 2: The Top Toolbar Area—consists primarily of Remitano tools that work with indicators and candles. In the left toolbar, you will have to draw and measure yourself when using tools like Fibonacci, and then the top toolbar is the place to contain the available indicators; if you want to use them, you need to integrate them with the Remitano chart.
The machine automatically calculates these indicators, and the trader does not have to calculate them. As a result, you must use the indicator to analyze the price trend without drawing anything else.
Part 3: The Main Chart Area—This is the most important part because it has the chart and all of Remitano's tools and indicators for analyzing prices.
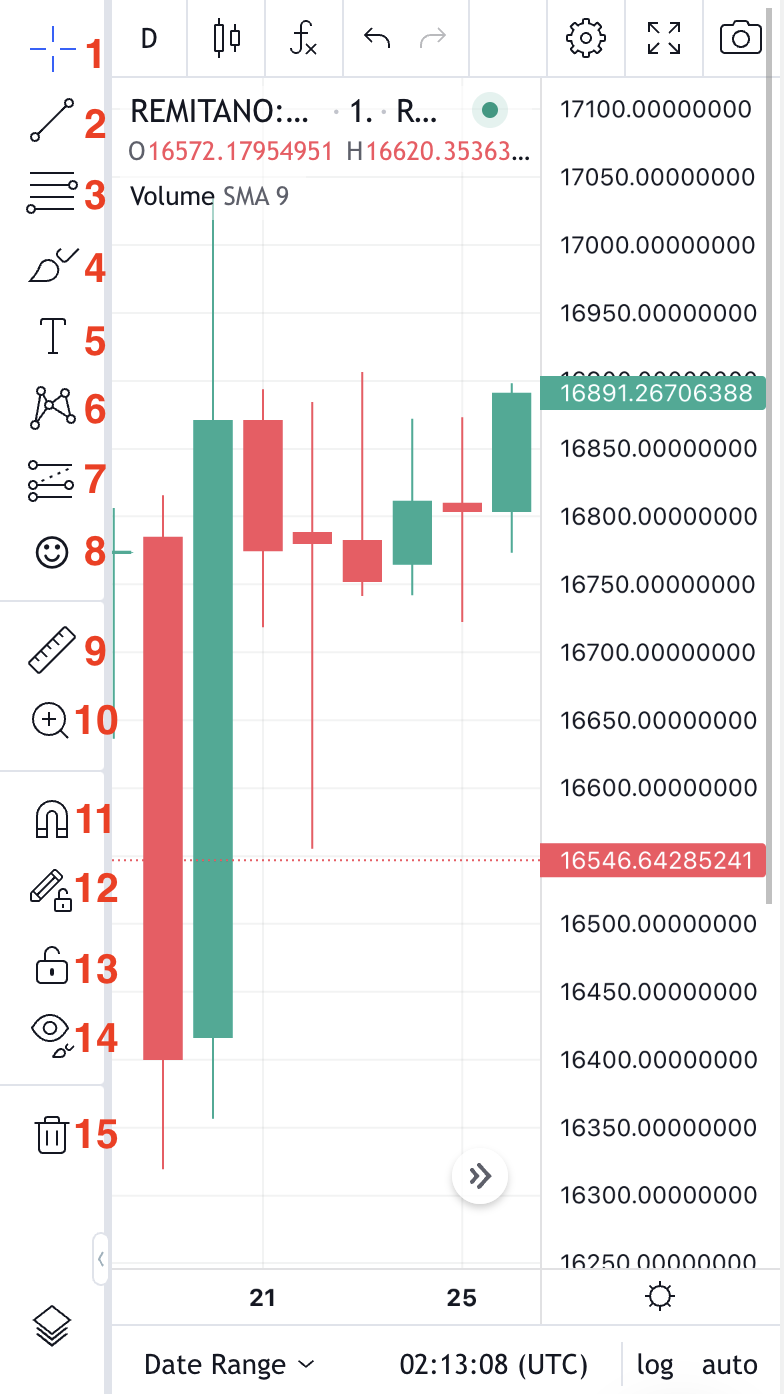
1/ Cursors
In this part, users can change the mouse pointer at will, including converting to arrows, dots, and shapes or erasers.
Users can use these tools to find price trends, areas of support and resistance, and so on by drawing trendlines. Drawing trendlines is fundamental knowledge that every trader must have.
These tools gather all the classic patterns that any trader will hear more or less, like the GANN box model, the GANN fan, the pitchfork pattern, the Fibonacci retracement, and the Fibonacci extension.

4/ Geometric Shapes
These drawing tools help to mark and display geometric shapes on the chart more visually. In addition, traders often use this section to explain or analyze something to other traders when they want to express their personal opinions or want to evaluate a particular coin pair.

These tools help you note down everything you want to include in the chart.

6/ Patterns
This part of the Remitano model is more complicated than the GANN or Fibonacci models, and not all traders know how to use it well. Or in case you want to use them, you must learn and understand them to apply them, such as triangle patterns, ABCD patterns, head and shoulders patterns, or other types of Elliott impulse wave patterns or patterns. Elliott Wave Triangle.

This section helps to measure price levels to know how to set the most appropriate R:R ratio. Or many traders also use this section to set up or share the odds for other traders to see about entry points, stop loss points and take profit.

8/ Icons
To make the chart more vivid and not boring, Remitano has provided a lot of different icons to personalize the chart to the max.

Count the number of candles in 1 area and 1 optional size to determine the distance.

10/ Zoom In
“Zoom in” allows you to zoom in on a specific chart area for easier viewing. This feature differs from dragging the mouse because you will zoom up the entire chart. Here, when you use the chart tool, it will automatically drag to the area you want to consider, making it more convenient.
11/ Magnet mode
The magnet can “attract” the prices like a magnet attracts iron. Therefore, when the magnet mode is activated, your cursor will quickly advance to the nearby candle’s open, high, low, and close levels.

This tool is handy when you draw Fibonacci Retracement or Fibonacci Extension levels and want to get the most accurate candle shadow or body. Or anchor a horizontal support or resistance level to specific open, close, high, or low prices.
12/ Staying drawing mode
You can’t use a tool multiple times at the same time. Each time you draw, you must click once on the icon on the toolbar. Thus, if you want to draw 10 trendlines, you will have to click on this toolbar 10 times, which is time-consuming! To improve, you can use the part to keep drawing mode to draw 1 line type and 1 tool type continuously without having to select the tool each time.
Known as “Lock,” when you turn on this mode, all the lines you draw will be locked, unable to move or stretch.
14/ Hide all Drawings
If you draw too much and don’t want to sit and make a “clattering” sound while deleting parts one by one, you can hit this button to erase all the lines you’ve drawn before.
15/ Remove Drawings
“Remove Drawings” is where you erase all the lines you’ve drawn and all the stats you’ve set. It will be a little different from the hidden part; hidden is only temporary, but in this part, when you click, all indicators or drawing tools will disappear immediately. There are 3 options: Remove drawing tools, remove indicators, and remove drawing tools and indicators.
This tool is especially useful when you draw Fibonacci Retracement or Fibonacci Extension levels and want to get the most accurate candle shadow or body. Or anchor a horizontal support or resistance level to specific open, close, high, or low prices.Multi-timeframe is where users can find the entire time frame provided by Remitano. Remitano has more timeframes than MT4 software. These timeframes are split into three parts: dates, weeks, and months.
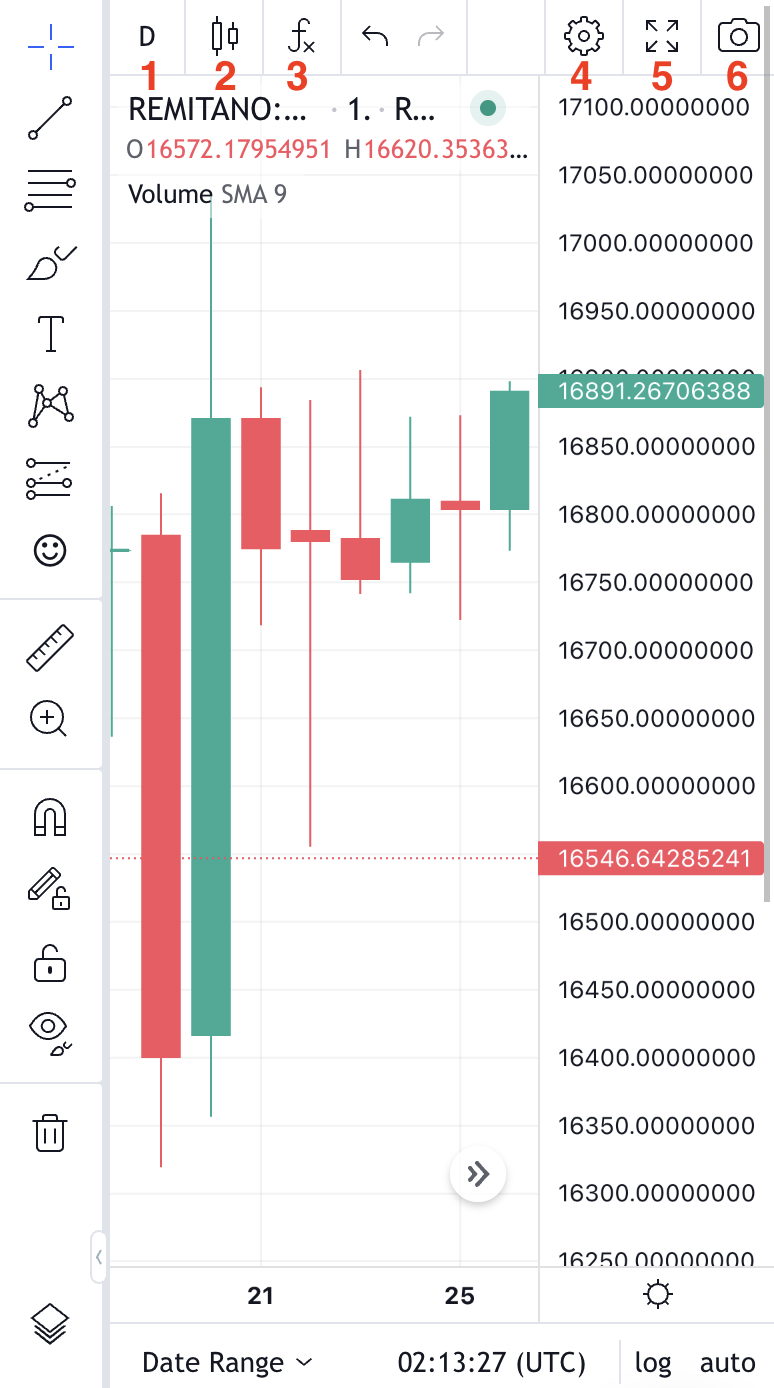
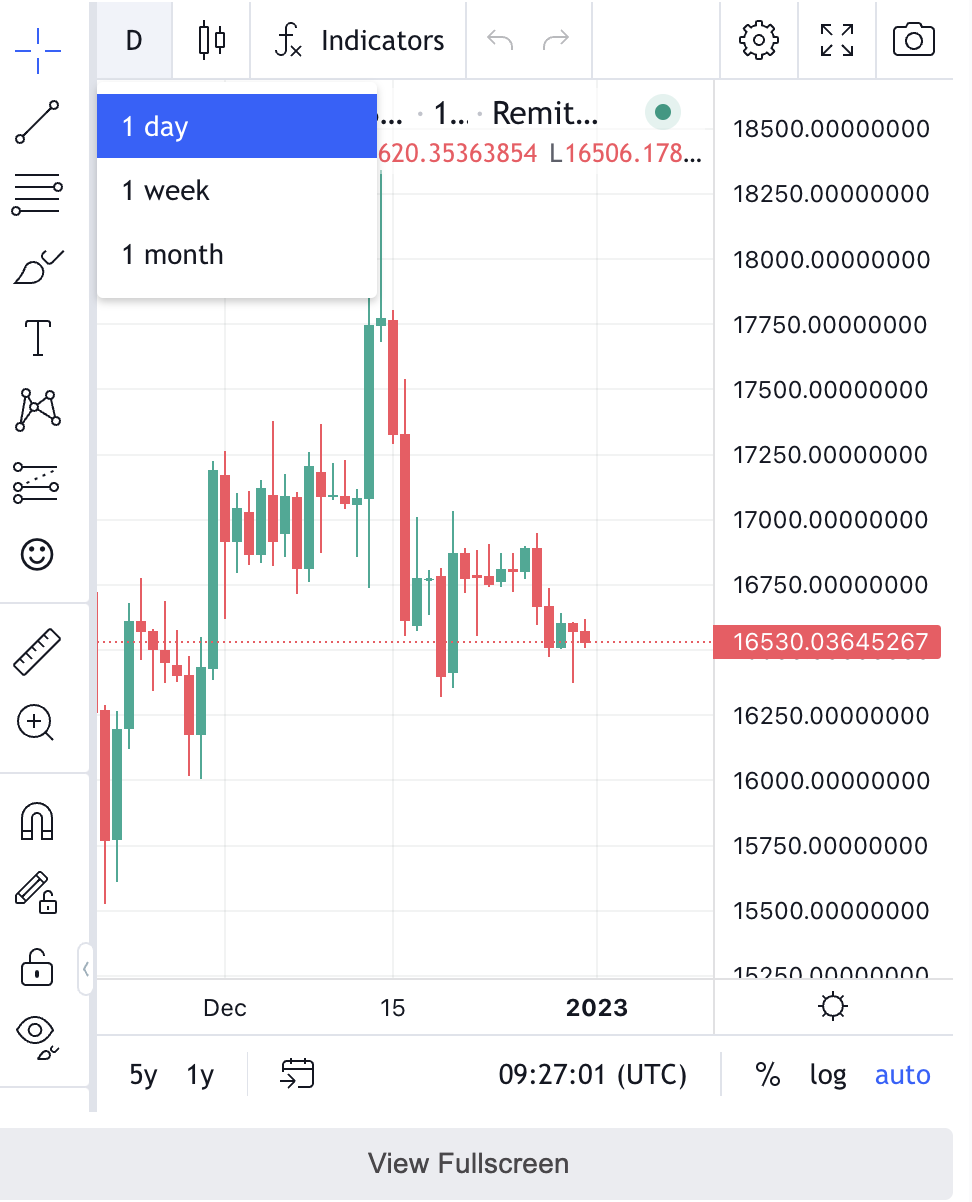
1/ Multi-timeframe
Multi-timeframe is where users can find the entire time frame provided by Remitano. Remitano has more timeframes than MT4 software. These timeframes are split into three parts: dates, weeks, and months.
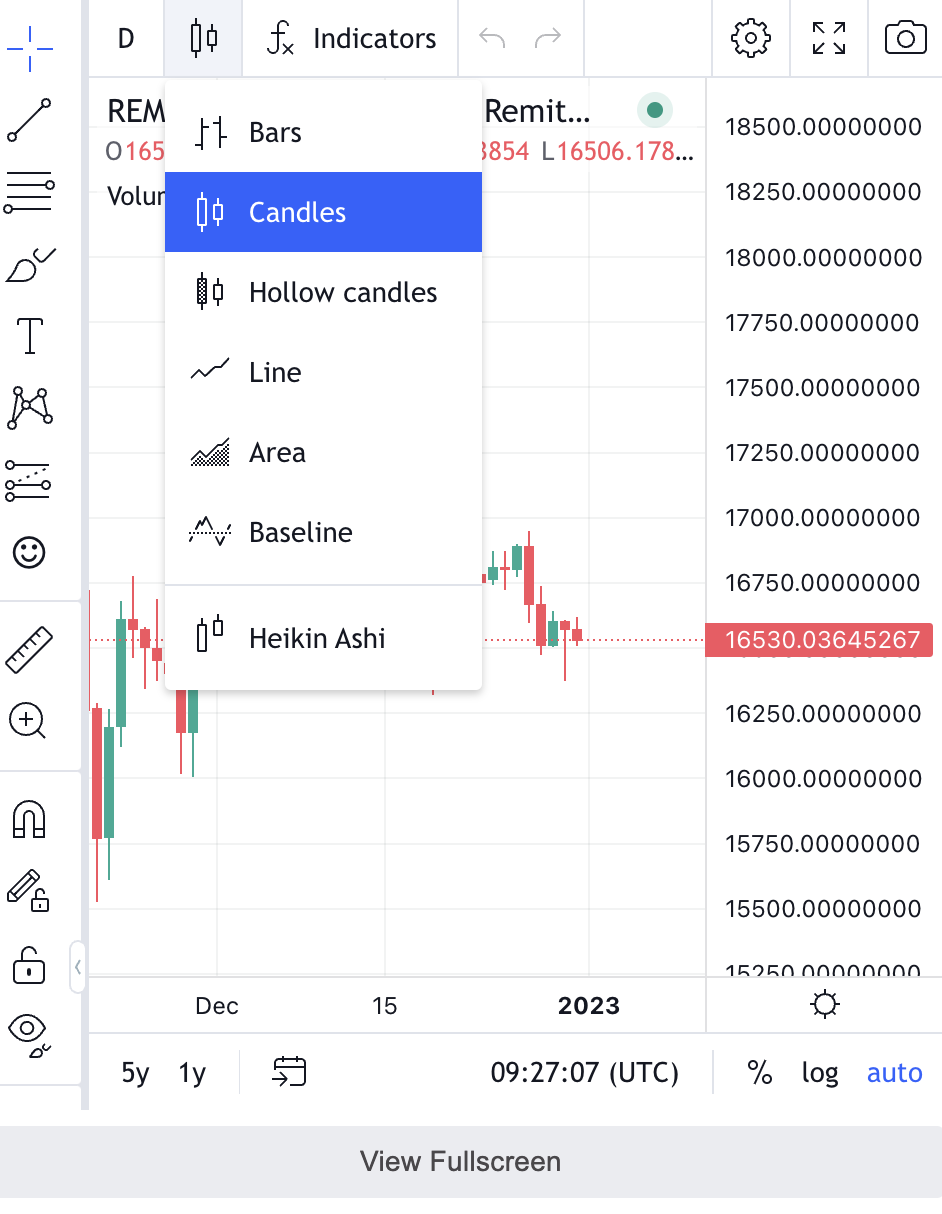
2/ Types of Candlestick Charts
It contains “treasures” for making trading decisions or investigating the market price situation. The most commonly used chart today is the Japanese candlestick chart. In addition, the Heikin-Ashi is also the chart used by many traders. First, however, you need to understand and grasp candlestick charts or reversal candlestick patterns.
3/ Indicators & Strategies
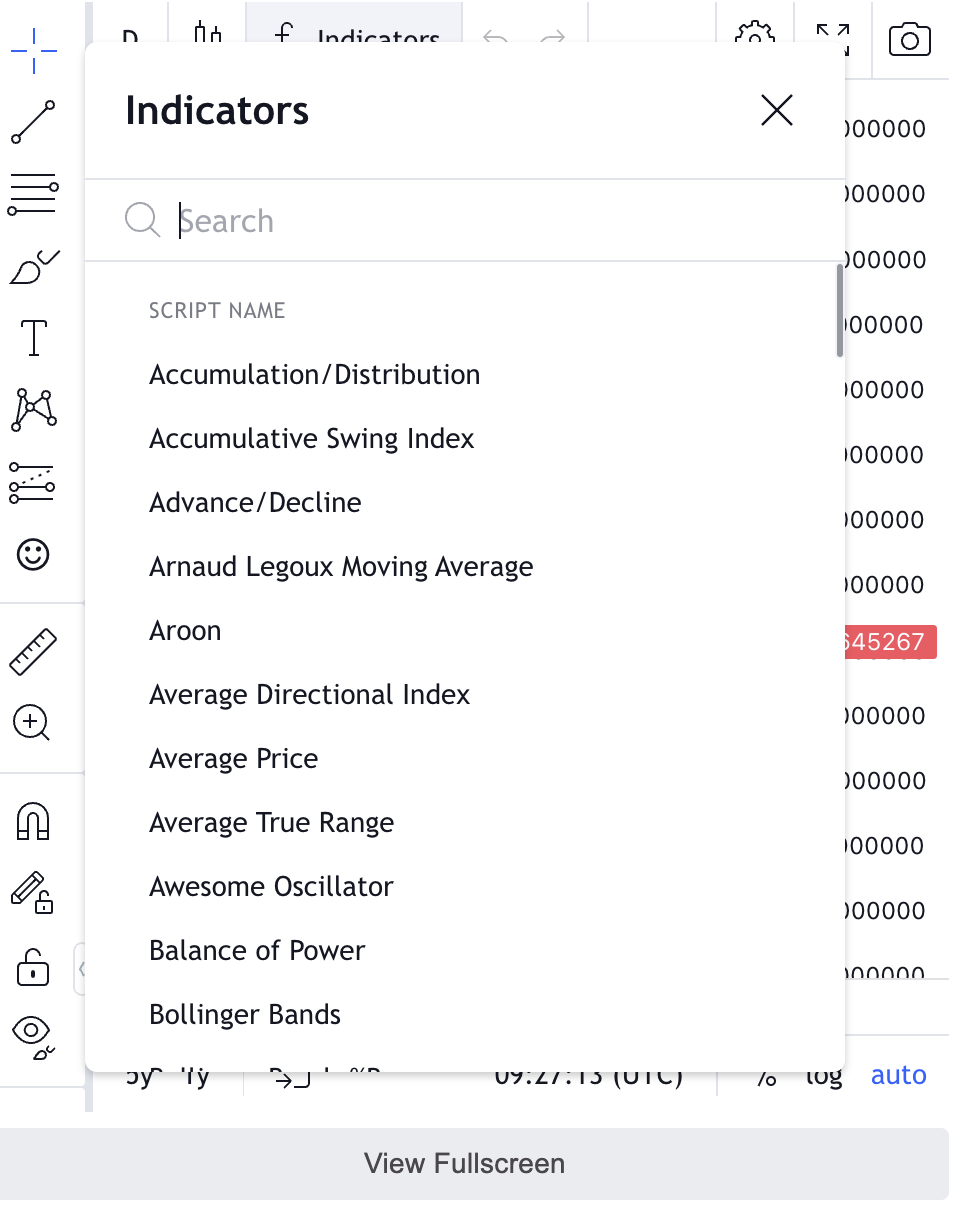
Most traders use a few things on the left side of the toolbar, like the trendline, along with the available indicators.
You will be able to add a lot of different indicators, from classics like Bollinger Bands and Moving Averages to RSI, MACD, and Ichimoku. Like many other sections that Remitano supports, here the indicator will include two main types: free and paid. However, all the popular indicators are free. To add an indicator to the chart, click on the icon as shown below, then fill in the indicator you want to add:
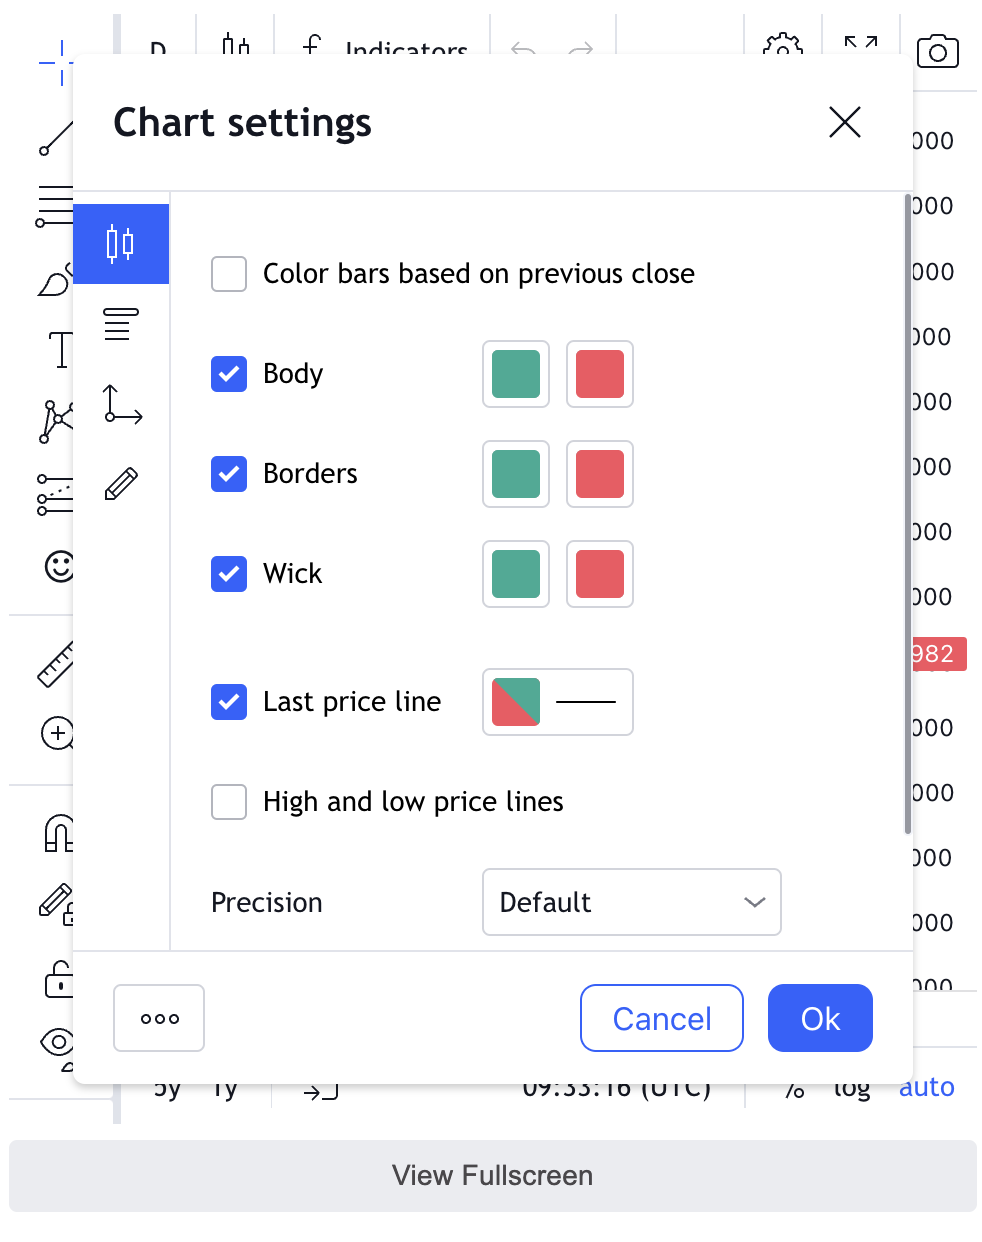
4/ Chart Properties
You can set the chart as you like, from candle color to candle border color, or change time frames.
5/ Full screen Mode
You can click here to transfer to full-screen mode.
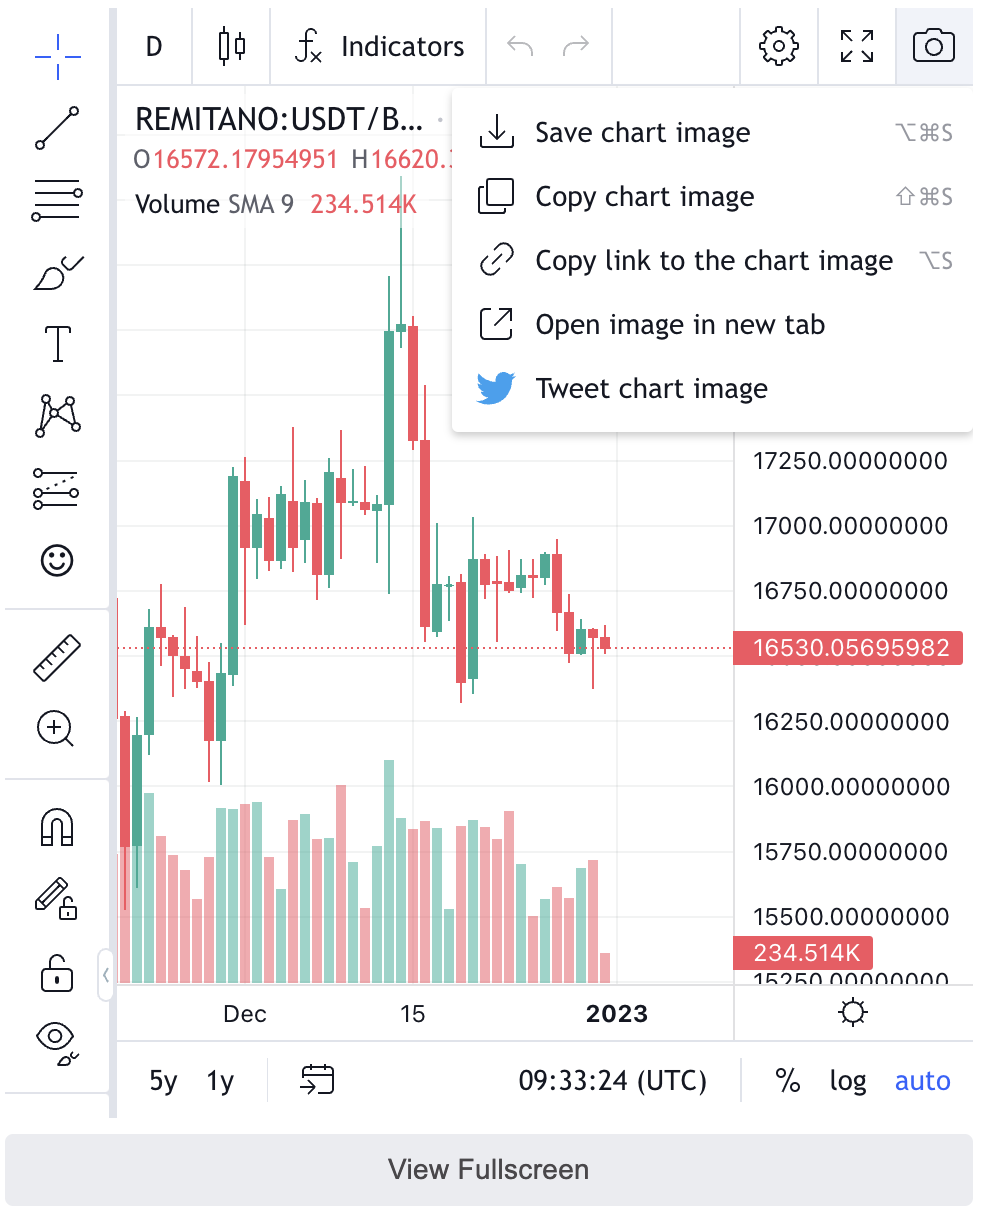
6/ Take a snapshot
With a single click, you can obtain photo urls or share photos.
Above is a guide on how to use Trading candlestick charts on Remitano; I hope this article helps you to trade btcusdt and ethusd more efficiently. Good luck with your trading!
If you have any questions about candlestick charts, please refer to customer support information or contact us directly through the chatbox below. Remitano support team is willing to answer you 24/7.





