Bitcoin / US Dollar
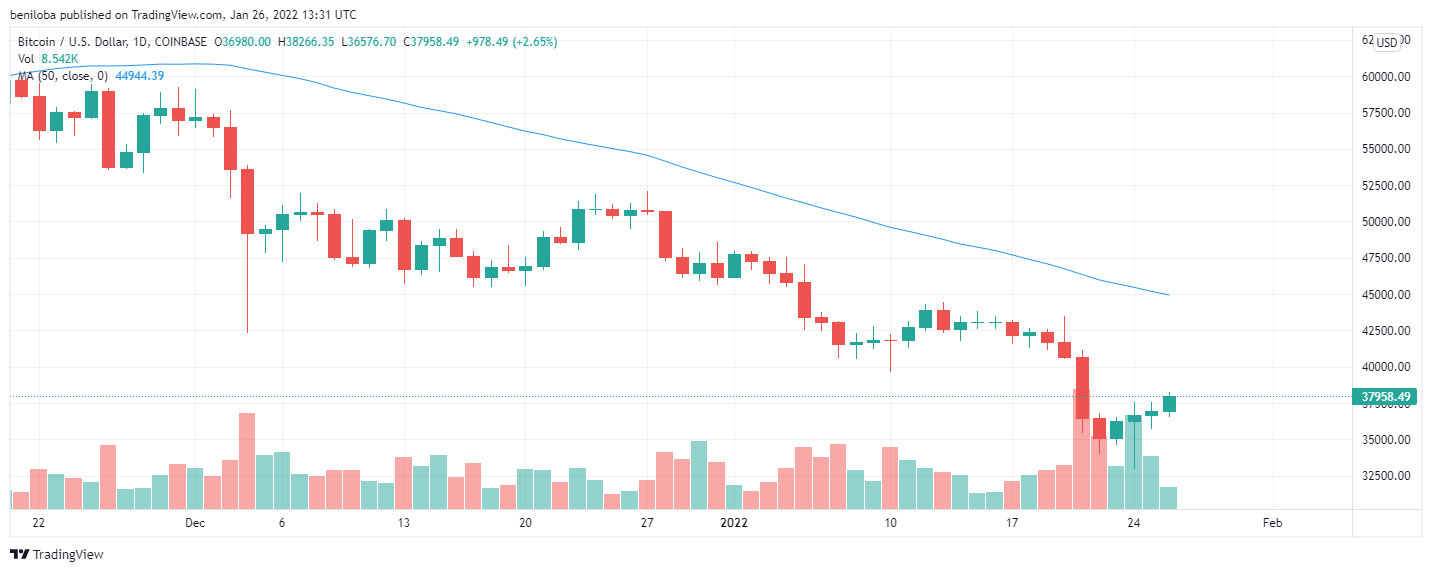
Following the significant bearish action over the last few days, the Bitcoin market looks to be making a gradual recovery.
On the 25th of January, the bulls continued their momentum of the previous day, influencing a 0.78% price gain, bringing the Bitcoin price to $36,980 per coin. The wick above the candle indicates the highest trading price attained by the bulls at $37,579, from which the bears rejected further growth. The bulls became the dominant force following resistance created to an initial bearish start to the market indicated by the wick below the candle, placing the lowest price point seen in the market at $35,716 per coin.
On the 26th of January, we see the bulls once again continuing their previous momentum, resulting in a 2.65% increase to $37,985 per coin. The wick below the candle indicates an initial bearish start to the market, which was faltered by the bulls, placing the lowest trading price at $36,576, while the wick above the candle indicates the highest trading price of $38,266 per coin.
From the above chart, we can see the bulls maintaining a steady climb in the market; however, over the midterm, the Bitcoin market remains in a downtrend, as indicated by the market trading below the 50-day moving average of $44,944.
Indicators
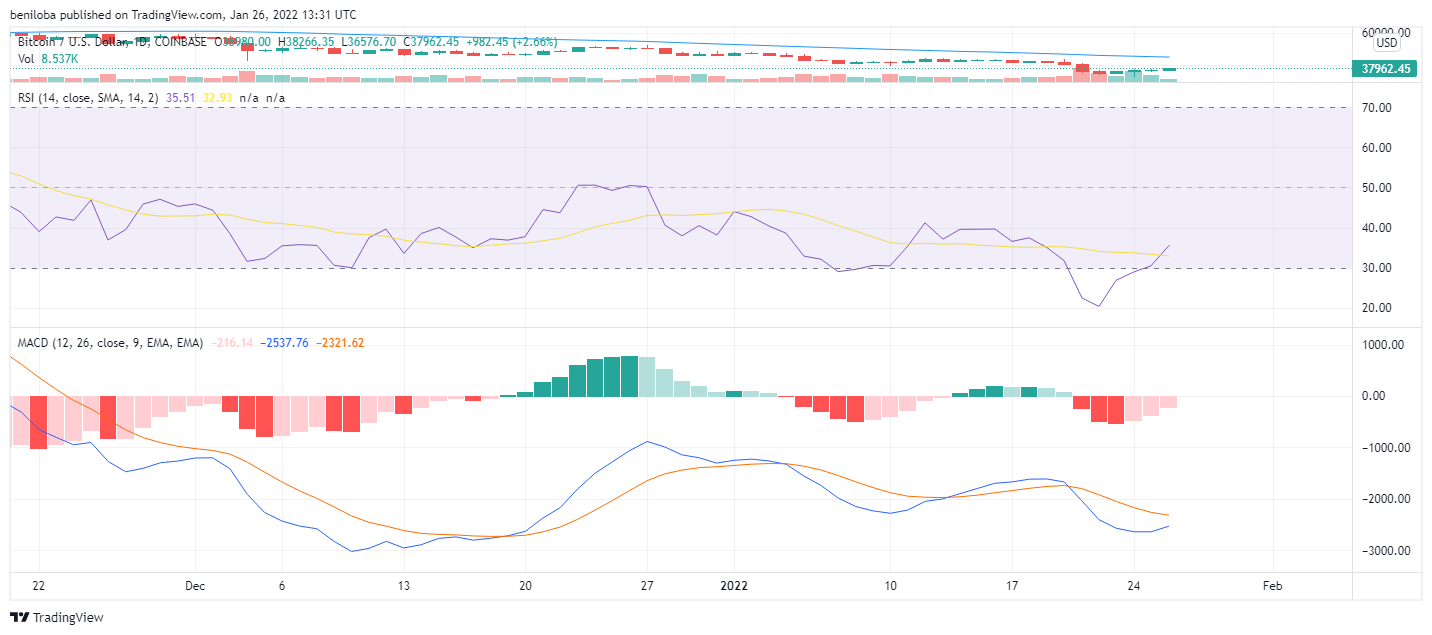
The relative strength index reflects the bearish dominance of the market. However, consecutive bullish action has resulted in the Bitcoin market coming out of an oversold market. On the 25th and 26th of January, the Bitcoin relative index experienced consistent growth, with its values being 30 and 37, respectively.
Due to consistent bullish action over the last few days, the histogram illustrates reducing bearish activity in the market. The MACD predominantly remains bearish as it is placed below the zero line; however, recent bullish activity has resulted in the MACD deflecting to the upside.
Buy and sell BTC on Remitano
Ethereum / US Dollar

On the 25th of January, the chart illustrates bullish dominance of the market. However, the bears had an early start to the market, toppled by the bulls as indicated by the wick below the candle, placing the lowest trading price of Ethereum for that day at $2,351 per coin. With the bulls establishing their dominance on the market, the ETH price increased by 0.78%, bringing the ETH price to $2,460 per coin. The wick above the candle indicates bearish resistance to further growth, placing the highest ETH trading price for the day at $2,509 per coin.
The bears attempted a pushback n the 26th of January; however, the bulls resisted such a move, shifting the market in their favor and placing the lowest trading price for the day at $2,415 per coin. With sustained bullish action, the ETH market increased by 5.38%, bringing the ETH price at the time of this writing to $2,593 per coin. With the market still far from close, we might see further bullish action. Nevertheless, the ETH market remains well below its 50-day moving average of $3,542, placing the market in a downtrend.
Indicators

Following consistent bullish action, the ETH market is out of the oversold zone (RSI below 30), bringing its value over the last two days to 26 and 32. Despite the price increase, the ETH market remains bearish territory as the RSI remains below the 50 mark.
In correlation to the relative strength index, the MACD remains bearish as it is placed below the zero line; however, the histogram though in bearish territory, shows a bearish reducing influence on the market.
Buy and sell ETH on Remitano
Ripple / US Dollar

Following the bearish action on the 24th, the bulls responded on the 25th of January after flipping an initial bearish momentum which saw the lowest Ripple trading price for the day at $0.587 per coin. With the bulls building momentum, the Ripple market experienced a 0.85% growth, bringing the XRP price to $0.617 per coin with the wick above the candle reflecting the bearish rejection of further price growth, placing the highest trading price for the day at $0.624 per coin.
The bulls flipped an initial bearish headstart to the market, turning it into momentum and influencing a 1.55% growth as at the writing of this piece, translating to a price of $0.626 per coin. With the market still far from its close, we can expect to see more volatility in the day. Nevertheless, the highest and lowest trading prices currently stand at $0.637 and $0.608, respectively.
The Ripple market trades below its 50-day moving average of $0.799, reflecting the current downtrend of the market.
Indicators
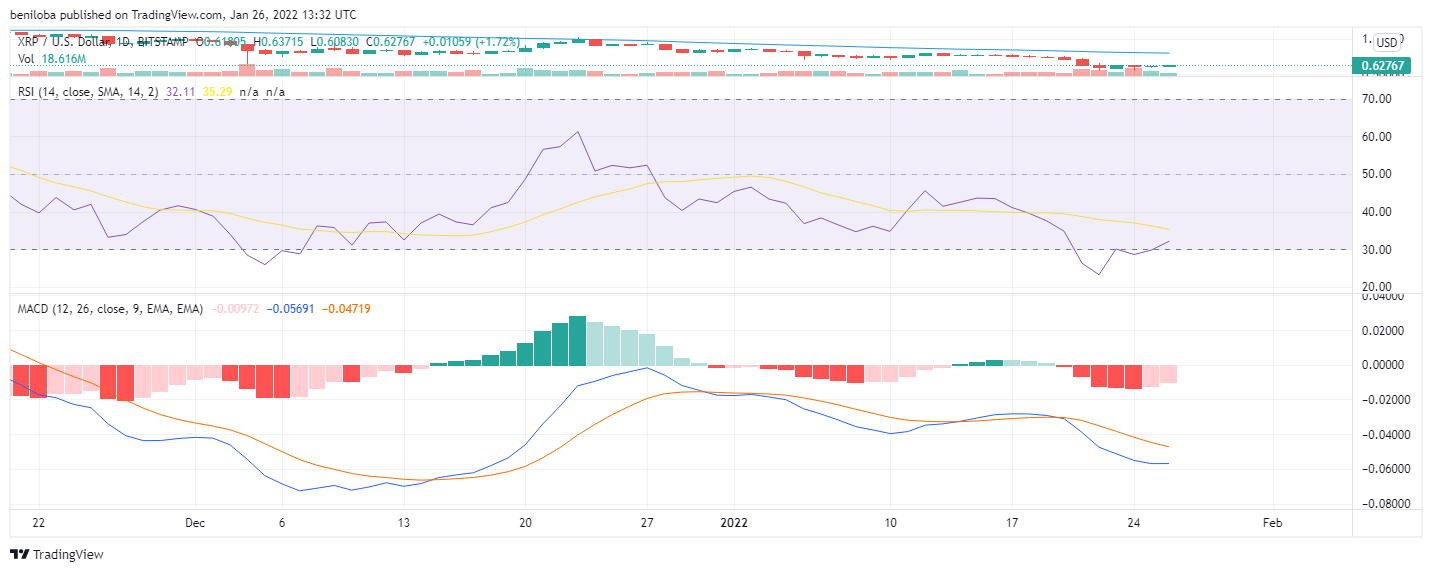
The Ripple market has escaped the oversold region (relative strength index below 30), reflecting the recent bullish activity in the market. However, the bears remain in control of the market as the relative strength index on the 25th and 26th of January remains below the 50 mark at values of 29 and 32, respectively.
The MACD remains below the zero line, indicating bearish dominance over the market; however, the histogram shows reducing bearish activity due to consistent bullish action seen over the last two days.
Buy and sell XRP on Remitano
Litecoin / US Dollar

The Litecoin market remains in a downtrend as it trades below its 50-day moving average of $142, and this is continued on the 25th of January as the bears ended the day as the dominant force in the market with a 1.60% drop, bringing the LTC price to $107 per coin. The wick below the candle indicates bullish resistance to further price, restricting the loss seen during the day and the lowest price seen in the market to $105 per coin, while the highest trading price seen during the day stands at $110 per coin.
The bears attempted to continue their momentum on the 25th of January, but this was met with bullish resistance, rejecting the price drop and flipping the market in their favor. With this move, the bulls succeeded in establishing a momentum which has seen the Litecoin price increase by 2.81%, bringing its value to $110 per coin, and which much more time to the close of the market, we could see further bullish action if the bears fail to provide significant resistance to the price growth. Nevertheless, as at the writing of this piece, the highest and lowest price points achieved so far stand at $111 and $106, respectively.
Indicators
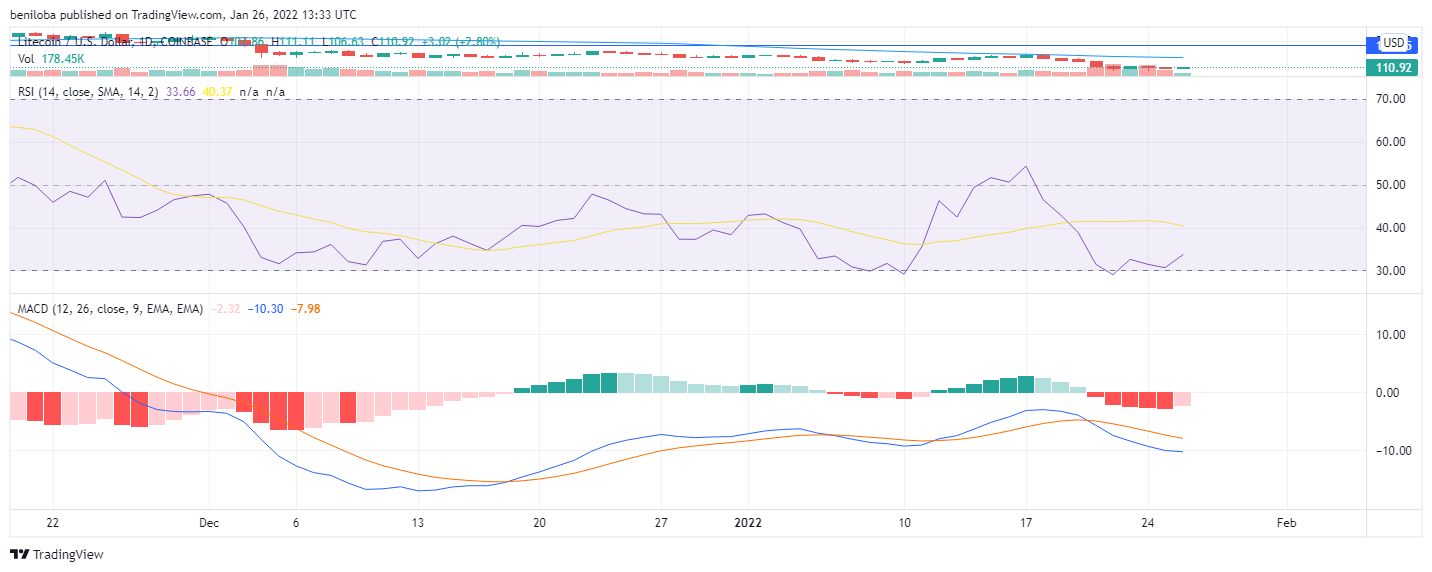
Unlikes several assets on this list, the LTC market succeeded in staying away from an oversold market ( relative strength index below 30) despite being in a bearish territory as indicated by the values below the 50 mark.
On the 25th of January, the bearish activity saw the relative strength index fall to 30; however, the bullish response on the 26th of January has resulted in a rise to 33.
The MACD remains below the zero line, a negative prediction for the market; however, though the histogram is below the zero line, it shows reducing bearish activity due to the bullish action seen on the 26th of January.
Buy and Sell LTC on Remitano
Bitcoin Cash / US Dollar

The bears succeeded in establishing their momentum on the 25th of January, which saw them gain dominance over the market. However, the wick below the candle shows a tight struggle between the bulls and the bears, with the bulls, can contain the loss seen on the day to a 0.28% drop, translating to a price of $291 per coin. With the tight struggle between the bulls and the bears, we see the highest and lowest trading prices for the day at $295 and $283, respectively.
With the previous day's momentum, the bears attempted to reestablish their momentum; however, the bulls resisted this move, resulting in the formation of the wick below the candle, indicating the lowest price point seen in the market so far $287 per coin. Following the flip in market momentum, the bulls have influenced a 3.30% increase in the Bitcoin Cash price, bringing its value to $301 per coin, while the highest trading price seen so far stands at $302 per coin. With the market still far from its close, we expect to see more volatility in the market.
Nevertheless, the Bitcoin Cash value over the last two days remains well below the market's 50-day moving average of $405, reflecting the clear downtrend the market is experiencing.
Indicators
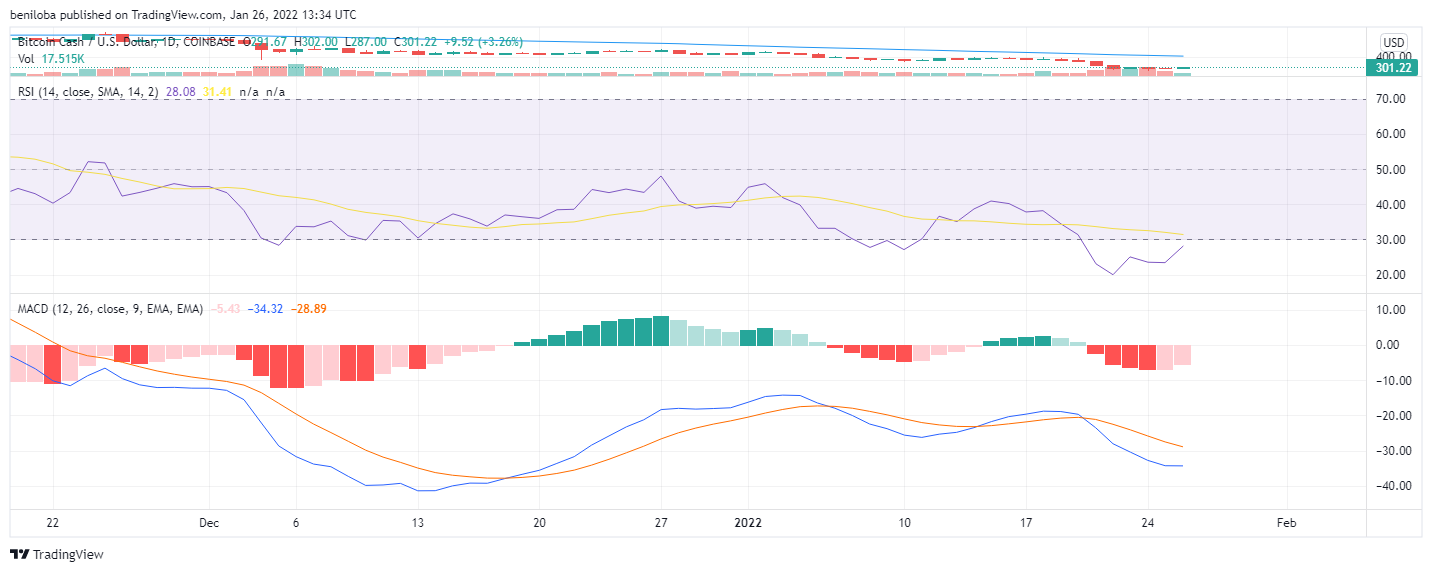
The Bitcoin Cash market remains in the oversold region as the relative strength index remains below 30. On the 25th of January, the RSI stood at 23; however, the bullish action on the 26th of January has increased to 28. Sustained bullish action could see the market break out of the oversold region with the market yet to close for the day. If the bulls succeed in getting the Bitcoin Cash market out of the oversold region, more work to be done as the market will remain in bearish control as the relative strength index would still be below the 50 mark.
As a reflection of the bearish activity in the market, the MACD remains below the zero line; however, recent bullish action sees the MACD deflect to the upside, which is correlated by the histogram, which although below the zero line, shows a declining bearish presence in the market.
Buy and sell BCH on Remitano
Cardano / US Dollar

The ADA market fell back into a downtrend following the market crash, which wiped out bullish efforts. On the 25th of January, the bears remained the dominant force in the market, influencing a 2.19% drop in the market, bringing the ADA price to $1.04 per coin, while the highest and lowest price points achieved stand at $1.07 and $0.99, respectively.
Following bearish supremacy on the last day, the bulls as seen establishing a hold on the market on the 26th of January after flipping an initial bearish action. With this move, the bulls gained control of the market, influencing a 5.30% growth as at the time of this writing, translating to an ADA price of $1.09 coin. The wick above and below the candle correspond to bearish and bullish resistance to further price change, respectively, and these correspond to the highest and lowest trading prices of $1.106 and $1.022 for the day.
Despite the price action seen over the last two days, the ADA market remains in a downtrend as it trades below its 50-day moving average of $1.28 per coin.
Indicators

With the bearish action over the last few days, the relative strength index stays below the 50 mark, indicating bearish dominance in the market. On the 25th of January, the RSI stood at 38, while on the 26th of January, bullish action has seen the RSI rise to 41, indicating growing bullish activity in the market.
The MACD remains below the zero line, confirming bearish dominance over the market; however, the histogram shows reducing bearish activity in the market due to the bullish action seen on the 26th.
Swap to ADA
Dogecoin / US Dollar
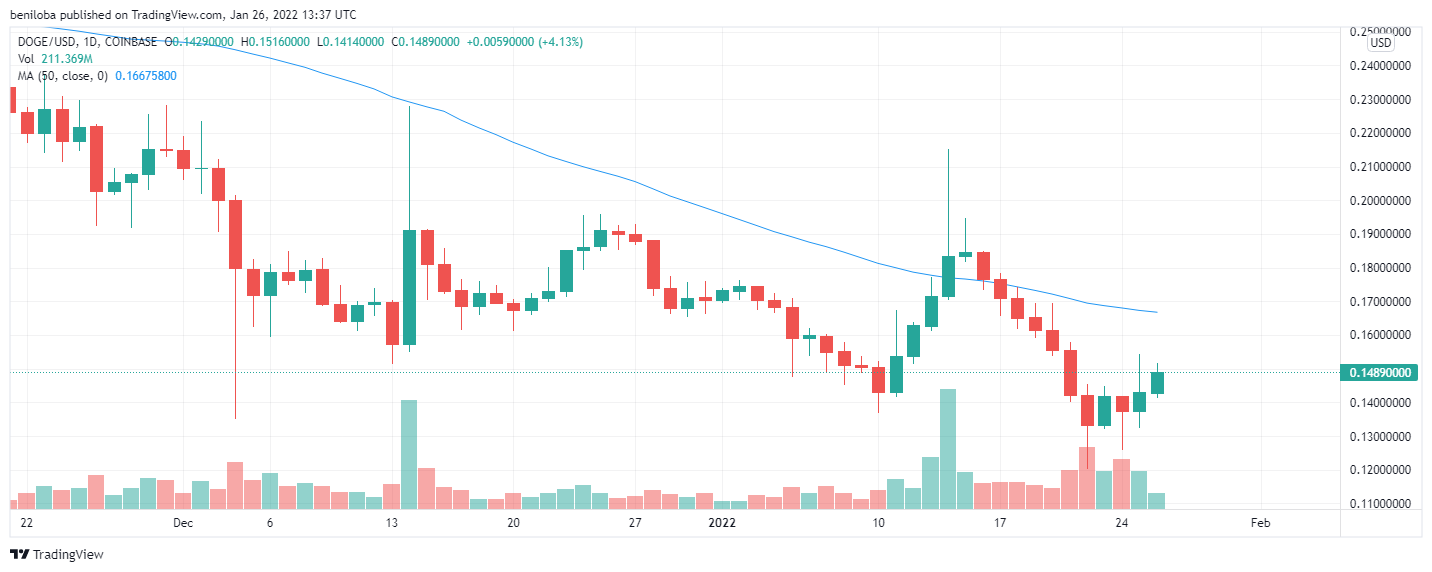
On the 25th of January, the bears attempted to gain control of the market, but the bulls resisted this move, flipping the market in their favor, resulting in a 4.08% increase in the Dogecoin price. At the close of the day, the Dogecoin price stood at $0.143 per coin, with the highest and lowest prices achieved being $0.154 and $0.132, respectively.
Midway through the 26th of January, we see the bulls continue their previous momentum, influencing a 4.13% increase as at the writing of this piece, bringing the Dogecoin price to $0.148 per coin, while the highest and lowest price points achieved so far stand at $0.151 and $0.141, respectively.
With the Dogecoin value over the last two days, the market remains in a downtrend, indicated by it trading below its 50-day moving average of $0.166 per coin.
Indicators

The relative strength index over the 25th and 26th of January stands at 39 and 43, reflecting growing bullish activity; however, with these values below the 50 mark, the bears still control the market.
The MACD is placed below the zero line, indicating bearish dominance; however, the histogram shows a reduction in the bearish activity in the market.
Swap to DOGE
correlations
- Bitcoin / Ethereum = 0.88
- Bitcoin / Ripple = 0.76
- Bitcoin / Litecoin = 0.88
- Bitcoin / Bitcoin cash = 0.78
- Bitcoin / Cardano = 0.78
- Bitcoin / Dogecoin = 0.60
Keynotes for today
- Bitcoin at $37,958 per coin.
- Ethereum at $2,593 per coin.
- Ripple at $0.626 per coin.
- Litecoin at $110 per coin.
- Bitcoin Cash at $301 per coin.
- Cardano at $1.09 per coin.
- Dogecoin at $0.148 per coin.