On the 26th of December, we see the bulls restarting their momentum, evidenced by a 0.74% price increase to bring the Bitcoin price to $50,801 per coin, while the highest and lowest price point encountered during the stands at $51,295 and $49,460 per coin. Also, from the above chart, we can see that this bullish action resulted from the flipping of a previous bearish action.
On the 27th of December, we see the bulls gaining progress in meeting the BTC 50-day moving average of $54,558 as its price has increased by 0.06% to bring the Bitcoin price to $50,832 per coin. However, this price gain is not significant to maintain the bullish pressure; as such, a consistent bearish activity could see the BTC market fall in bearish control. However, with the BTC price still below its 50-day moving average, the BTC market remains slightly in a downtrend which can be broken out of.
Indicators

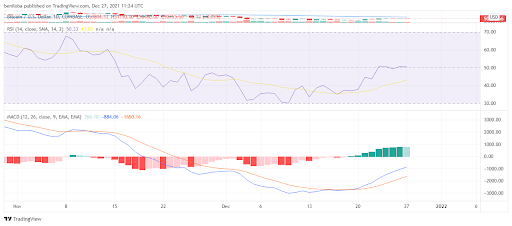
Following the general bullish action across the last three days, the relative strength index is maintained just above the 50 mark, indicating a fairly stable market in favour of the bulls. On the 25th of December, the RSI stood at 49, slightly in bearish control. At the same time, the relative strength index on both the 26th and 27th of December stands at 50.50 and 50.29, respectively.
Despite the bears trying to establish momentum, the MACD still progresses towards the zero line, indicating a growing bullish presence in the market. The histogram correlates this; however, due to the bearish action on the 27th, we see reduced bullish action.
Ethereum / US Dollar

Following Ethereum’s huge pump on the 23rd of December, the platform has experienced extensive bearish action. However, on the 25th of December, we see that the bulls were able to resist further price drop as indicated by the wick below the green candle; however, the huge wick above the candle shows the bears did not go down without a fight, rejecting the ETH price from its daily high of $4,143, while the lowest price point achieved on that day stood at $4,021.
On the 26th of December, we see the bears responding to the bullish action on the previous day, with the wick below the candle indicating that the bulls rejected further downward action from a price point of $4,008. The highest price point seen during the day stood at $4,106. However, the ETH price dropped by 0.77% to bring the ETH price to $4,065 per coin.
Following the bearish pump of the previous day, the ETH bulls are attempting to restart their momentum, which has resulted in a 0.52% increase to bring the ETH price to $4,087 per coin, while the wicks above and below the candle indicate the struggle for dominance between the bulls and the bears.
From the last few days, we can see that Ethereum is making its way back to its 50-day moving average of $4,247. Therefore we could see the ETH market effectively break out of a downtrend if the bulls sustain this momentum.
Indicators
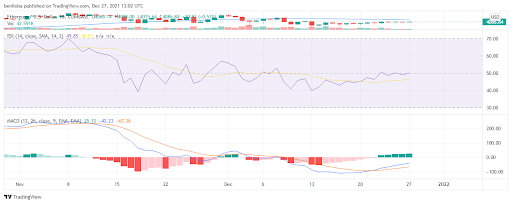
The chart above shows that the relative strength index remains stable on the 50 mark, which illustrates relative stability between the selling and buying in the market. On the 25th of December, we see the relative strength index stand at 50; however, the bearish action on the following day has resulted in a fall to 49, which means the bears slightly had the upper hand on the 26th. On the 27th of December, we see the bulls reigniting their momentum, which has brought the relative strength index 40.83; therefore, sustained bullish action could see the bulls back in control.
The MACD correlates with the RSI, indicating a growing bullish presence in the market. The histogram also shows a growing bullish presence.
Ripple / US Dollar

Following the massive bearish action on the 24th of December, we see that the bulls attempted to regain the XRP losses; however, though successful in gaining control of the market, the gains were not significant enough to recover the previous gains. On the 25th of December, we see the bulls initiate a push back, resulting in a 1.55% increase to bring the XRP price to $0.926 from an opening price of $0.911 per coin. On the 26th of December, the XRP market fell by 0.58% to bring the XRP price to $0.920 per coin, while the highest and lowest price points seen in the market stand at $0.933 and $0.905, respectively.
On the 27th of December, we see the XRP bulls resuming their move to the Ripple 50-day moving average of $0.974 with a price of $0.928, translating to a 0.80%, above which will indicate the XRP market is back in a bullish trend.
Indicators

The above chart shows that Ripple remains in bullish control in the short term, as indicated by a relative strength index of above 50. On the 25th of December, the XRP RSI increased to 52, indicating an increasing bullish presence, while the relative strength index on the 26th and 27th of December stands at 51 and 52, respectively.
As an illustration of the bullish action, the MACD stands at the zero line; however, the histogram shows bullish action but reduced intensity.
Litecoin / US Dollar
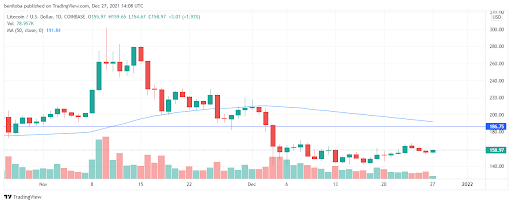
Unlike most other altcoins, the Litecoin market has experienced consecutive bearish action across the last few days. On the 25th of December, the LTC price opened at $161 per coin, after which the bears flipped a budding bullish action to gain control of the market as indicated by the wick above the red candle.
The resulting bearish action resulted in the LTC price falling by 2.08% to bring the LTC price to $158 per coin. On the 26th of December, we see the bears keeping up their bearish action, therefore, inflicting a further 1.29% to bring the Litecoin price to $155 per coin from an opening price of $157. The highest and lowest price points seen in the market stand at $158 and $153, respectively.
On the 27th of December, we see the bulls attempting the gain control of the market after experiencing consecutive bearish actions. We see the LTC price increase by 1.93% to bring its price to $159 per coin, while the highest and lowest price points achieved so far stand at $159 and $154, respectively.
The above chart shows that the LTC market is still in the downtrend without experiencing significant bullish action to bring it out of such strength. This is indicated by the LTC market trading below its 50-day moving average of $191.
Indicators

In correlation to the 50-day moving average, the relative strength index agrees with the main chart that the LTC market remains in bearish control as indicated by the RSI trading below 50.
We see the relative strength on the 25th and 26th stand at 44 and 43, respectively, after two days of consecutive bearish action. While the bullish action on the 27th of December, though minimal, has resulted in a relative strength index of 45.
We see that the Ripple MACD has stalled in its accession to the zero line as indicated by its flattening, while the histogram shows a reduction in the bullish presence in the market. With the MACD below the zero line, the LTC market remains in bearish control over the extended period. However, if the bulls succeed in mustering just enough momentum, we could see the LTC market break out from bearish control.
Bitcoin Cash / US Dollar
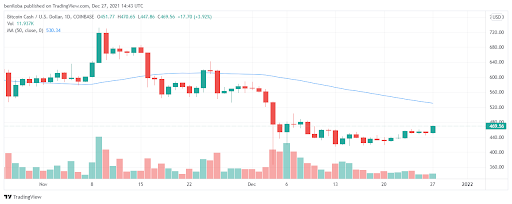
On the 24th of December, the Bears initiated an early move for dominance in the market; however, the bull resisted the push and succeeded in turning this resistance into momentum to gain control of the market. However, the wick above the candle also suggests that the bears resisted major price growth, thereby restricting the price gains to 0.68% to bring Bitcoin Cash to $455. On the 26th of December, the bears initiated a push resisted by the bulls indicated by the wick below the candle to bring the Bitcoin Cash price to $451.
Following a fair period of stability over the last two days, Bitcoin Cash experienced significant action on the 27th of December. Its price increased by 3.92% to bring the Bitcoin Cash to $469 per coin. The highest and lowest price point seen so far are $470 and $447, respectively.
The Bitcoin Cash chart shows that the BCH market is still in a downtrend, as indicated by the market trading below its 50-day moving average of $530.
Indicators

On the 25th and 26th of December, the Bitcoin Cash relative strength index stood at 44 and 43, which is placed below the 50 mark indicates the dominance of bearish selling against bullish buying. On the 27th of December, we see the relative strength index increase to 49, indicating a growing bullish presence in the market.
Despite relative stability, we see the MACD continue its rise to the zero line, and this is correlated by the histogram, which shows growing bullish entry into the market. The bulls can effectively get the Bitcoin Cash market back in a positive bearing with sustained bullish action.
Cardano / US Dollar
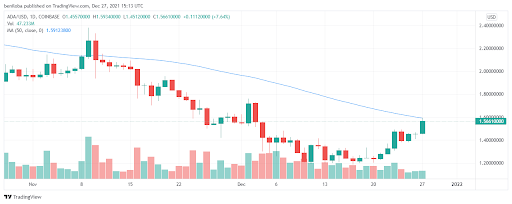
Following extreme bearish action since hitting all-time highs, the ADA market is finally experiencing bullish action.
On the 25th of December, we saw the ADA price increase by 4.36% from an opening price of $1.39 to $1.45 per coin. With this price action, the bulls attempted to continue their momentum on the 26th of December. However, resistance from the bears limited the day's gains to 0.05%.
On the 27th of December, ADA became one of the best-performing assets of the day by increasing by 7.64% to bring its price to $1.56 per coin. However, the gains recorded were higher as the asset hit a high point of $1.59 per coin, putting it at its 50-day moving average of $1.591, but the wick shows the bears greatly rejected this price movement.
Indicators
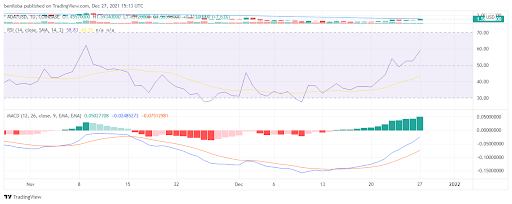
The relative strength index indicates a growing bullish presence in the market as it places above the 50 mark. On the 25th of December, we see the ADA relative strength index rise to 52, while the RSI on the 26th and 27th of December stands at 52 and 58, respectively. The ADA market remains in bullish control, with these values above the 50 mark.
With the continued bullish action seen over the last few days, the MACD edges closer to the zero line together with the histogram, indicating a growing bullish presence in the market.
Dogecoin / US DOllar
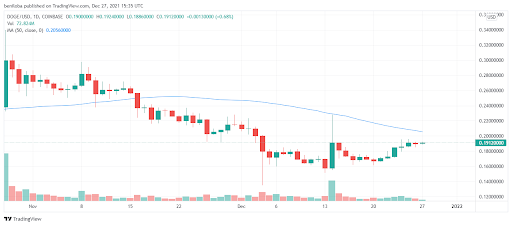
The Dogecoin market still struggles to muster significant momentum. On the 25th of December, the Dogecoin price experienced bullish action, but the wick above the candle indicates the bears provided significant resistance.
However, the Dogecoin market experienced a 2.63% increase to bring the Doge price to $0.191 per coin. The 26th of December sees a bearish push though not strong enough due to bullish resistance, bringing the Dogecoin price down by 0.63% to stand at $0.189 per coin.
The 27th of December sees the bulls attempt to establish momentum; however, resistance from the bears has restricted the Dogecoin gains to 0.68% to bring its price to $0.191 per coin.
The Dogecoin market remains predominantly in a downtrend as it still trades below its 50-day moving average of $0.205 per coin.
Indicators

Despite a stalling market, the Dogecoin relative strength index remains above 50, indicating the dominance of the bulls in the market. The relative strength index on the 25th, 26th, and 27th of December stands at 52.91, 52.19, and 53.
The MACD continues its steady ascent to the zero line, while the histogram shows the increasing intensity of bullish activity.
Correlations
- Bitcoin / Ethereum = 0.91
- Bitcoin / Ripple = 0.77
- Bitcoin / Litecoin = 0.80
- Bitcoin / Bitcoin cash = 0.48
- Bitcoin / Cardano = 0.36
- Bitcoin / Dogecoin = 0.76
Keynotes for today
- Bitcoin is still above $50,000. Current price at $50,832.
- Ethereum steady above $4,000. Currently stands at $4,087.
- Ripple at $0.928 per coin.
- Litecoin at $159 per coin.
- Bitcoin Cash at $469 per coin.
- Cardano at $1.56 per coin.
- Dogecoin at $0.191 per coin.