Introduction:
Understanding the volatile nature of cryptocurrencies is critical for both new and experienced traders. Of these, Ethereum has undoubtedly attracted significant attention, such that understanding Ethereum Price fluctuation forms a vital part of a successful strategy. This article will give you insights into how to read and predict these changes effectively.
The Basics: What Influences the Ethereum Price?
Ethereum price, like most cryptocurrencies, is influenced by a variety of factors. It's important to understand these elements when investing or trading in Ethereum.
1. Supply and Demand
The first major factor in Ethereum's price is supply and demand, just it is with any tradable asset. If more people are buying Ethereum than selling it, the price will rise. Conversely, if more are selling than buying, the price will fall.
Since Ethereum is a blockchain platform that hosts various other tokens and projects, the overall use and popularity of these hosted tokens and decentralized applications (DApps) can also impact its value. Ergo, the more these projects thrive, the more the Ethereum network becomes in demand which drives up the value of Ether (ETH), the platform’s native cryptocurrency.

3. Inflation
Ethereum, unlike Bitcoin, doesn't have a capped limit. This means that there's still an inflow of new Ethereum onto the market, which can affect the perception of value and price.
4. Regulatory News and Events
Any news regarding the regulation of cryptocurrencies can cause prices to fluctify wildly. Positive news can drive up demand, while negative news (like a country imposing restrictions on crypto trading) can lower it.
5. Technology Changes
Ethereum is currently in the process of upgrading to Ethereum 2.0, featuring Proof of Stake (PoS) consensus mechanism, sharding, and more. These and similar technological changes can greatly influence the Ethereum price, as they promise faster transaction speeds and increased scalability.
6. Market Sentiment
Finally, like other cryptocurrencies, Ethereum is susceptible to market sentiment. This is often driven by media coverage, positive or negative news about cryptocurrencies in general or Ethereum in particular, or even social media buzz.
The Impact of Crypto Price Variations on South African Economy
Understanding all these elements can help make sense of price changes and potentially predict future trends. However, it's important to remember that the crypto market is extremely volatile and predicting price changes can be difficult, so always do your research and consider your financial situation and risk tolerance.
Understanding and predicting the price fluctuations of Ethereum necessitates the right tools and methodologies. Let's delve deeper into the key instruments that traders use to keep tabs on these changes:
1. Historical Data
Before you can anticipate the future, you must understand the past. Historical data regards the price of Ethereum over time, and combing through this information can reveal certain trends or patterns in price movement. There are various online resources where you can access' worth of data. The comparison of year-on-year, month-on-month or day-on-day data can give vital insights into potential future behavior.
2. Charts:
Price and trading volume charts are one of the most commonly used tools for price prediction. These graphical representations enable traders to visualize fluctuations in price over specific periods. Two common types of charts used are line charts and candlestick charts. Line charts show the closing price for each time period, providing a simplified visual of price movements. On the other hand, candlestick charts provide more detailed information—opening, closing, high, and low prices—giving traders a more nuanced view of price behaviors.

3. Indicators
These are statistical tools that traders use to understand market trends and foresee potential future price movements. Common indicators include the 'Moving Averages', which shows an average value of price over a certain period to highlight trends, and 'Relative Strength Index (RSI), which quantifies price momentum to determine overbought or oversold conditions. Volume indicators represent the amount of Ethereum traded within specific periods and can offer insight into the strength or weakness of price movements.
4. Ethereum News Tracker
Often overlooked as a tool, keeping abreast of news relating to Ethereum can be a significant price driver. Technological updates to the Ethereum blockchain, changes in regulations, or major announcements from influential figures can dramatically affect Ethereum's price.
Utilizing a good trading platform is integral in monitoring and predicting Ethereum's price fluctuations. These platforms usually provide all the essential tools mentioned above, in addition to providing real-time data and an interface for executing trades.
What an Ethereum Price Surge Means for South African Investors: A Simplified Perspective
As this space continues to evolve, new tools are constantly emerging, making it easier for traders to analyze and predict Ethereum price fluctuations accurately. Always remember, while these tools can aid in predictions, they can't guarantee performance, so exercising caution and risk management while trading remains paramount.
Understanding chart Patterns for Ethereum Price Prediction
Chart patterns play a fundamental role in predicting the price of Ethereum. They are essentially a series of price movements depicted in a charted pattern that traders utilize to identify market trends and predict future price movements. Below, we delve into this topic more in-depth.
1. The Cup and Handle
This pattern, which resembles a teacup on its side, consists of a 'cup' (a U-shaped pattern) and a 'handle' (a slight downward drift). The cup forms after a strong upward movement when sell-offs cause the price to drop and then rise again to approximately the original level. After this, the handle forms as a smaller period of consolidation or minor downward trend. Once the price breaks above the handle's resistance level, it typically signals a bullish market, suggesting an upcoming price increase.
2. Head and Shoulders
This pattern is characterized by three peaks, with the middle one (the head) being the highest and the two others (shoulders) at similar lower levels. This pattern typically signals a bearish market, indicating potential downward price movement following the completion of the pattern.
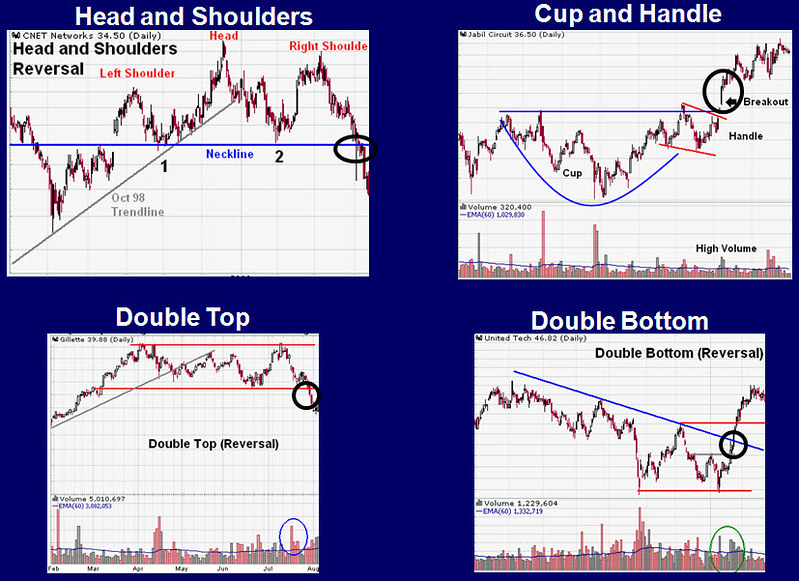
3. Double Top and Double Bottom
A double top pattern is formed when the price reaches a particular high point twice and declines after each time, indicating strong resistance level. Conversely, a double bottom pattern occurs when the price hits a certain low point twice and rebounds each time, indicating a strong support level. These patterns suggest that the price could break out in the opposite direction.
4. Triangles
Triangle chart patterns include ascending, descending, and symmetrical triangles. These are formed by the convergence of an asset’s support and resistance levels. Triangles can be continuation or reversal patterns, depending on their direction and where they appear in a trend.
5. Bullish and Bearish Flags
These continuation patterns resemble flag shapes on charts, where the 'pole' represents a strong price movement, followed by a parallelogram-shaped ‘flag’ denoting consolidation. The breakout, either below (bearish) or above (bullish) the flag, typically continues in the direction of the initial price movement.
6. Rectangles
These are also continuation patterns, representing periods of consolidation before the price continues its existing trend. They’re formed by parallel support and resistance lines, which the price bounces between.
Each of these patterns can indicate potential buying or selling opportunities within the Ethereum market. Applying such patterns combined with other analysis tools can increase accuracy in Ethereum price prediction. With practice and careful observation, chart patterns can become a valuable part of any trader's toolkit.
What is CryptoCurrency Security Standard (CCSS) and How Does it Enhance Remitano Security?
Remember, while chart patterns can be helpful, they are just one tool among many. It's essential always to use them in conjunction with other indicators and to stay aware of the inherent volatility.
Making Calculated Trading Decisions using Ethereum Price Predictions
Once you have a grasp on understanding the market trends and data, it’s time to implement those insights into practical trading strategies. Here's how you can make more calculated decisions using Ethereum price predictions:
1. Consider Your Trading Goals
One of the first steps towards making calculated trading decisions is considering your investment goals. Things like your risk tolerance, investment timeline, and financial needs all play crucial roles in shaping your trading strategy. For example, traders with a high risk tolerance may prefer to trade on short-term price fluctuations, while those with low risk tolerance may opt for a long-term hold strategy.
2. Apply Technical Analysis
Utilize the chart patterns, indicators, and tools we mentioned earlier to identify opportunities and threats. This involves looking for patterns within historical and current price charts to predict future price directions. It's important to understand that no singular approach guarantees 100% accuracy, so it’s wise to incorporate multiple indicators and techniques to increase your chances of making accurate predictions.
Rapid advancements in Blockchain technology and unpredictable regulations mean news can significantly impact Ethereum's price. Therefore, constantly staying updated with cryptocurrency industry news and events can help you anticipate sudden price changes.
4. Risk Management
Avoid investing more than you can afford to lose. Implement stop-loss and take-profit levels—pre-determined prices at which your Ethereum will be sold automatically—to protect against significant losses if the market moves against your favor. Also, diversification is important in mitigating risk by spreading your investments across different assets.
5. Iterative Learning
The last step, yet an essential one, is learning from your trades. Keep track of your successful and unsuccessful trades, and once you’ve got enough data, go over your history to find what worked and what didn’t. Based on that, make necessary adjustments to your strategies.
Decoding Bitcoin Bull-Run: The Ups and Downs Explained for South African Enthusiasts
By developing these practices, traders can make more calculated decisions rather than relying purely on luck or emotion. However, it's important to understand that even with accurate predictions and well-calculated decisions, success in trading is not guaranteed. The crypto market is unpredictable by nature, and the risk of loss is always present. Always conduct in-depth research and consider working with a financial advisor to navigate the complex world of Ethereum trading effectively
Taking Your First Step towards Ethereum Trading
Armed with this knowledge, start your journey in Ethereum trading. Always stay informed and constantly update your strategies and tools based on muted or drastic fluctuations in the Ethereum Price. Platforms like Remitano provide a perfect place for both novice and experienced traders to venture into the exciting world of Ethereum trading.
Conclusion:
The world of cryptocurrency has evolved beyond Bitcoin, and Ethereum has emerged as a solid contender for digital traders worldwide. Understanding Ethereum Price fluctuations is just a stepping stone towards successful trading. Remember, practice leads to perfection. So, continue refining your trading skills, and remember to share this article with fellow crypto enthusiasts eager to dive into Ethereum trading on Remitano and other platforms!
Join us in X and Facebook to stay tuned with all the promos and special events that we will carry for you!