Bitcoin / US Dollar
Price Analysis
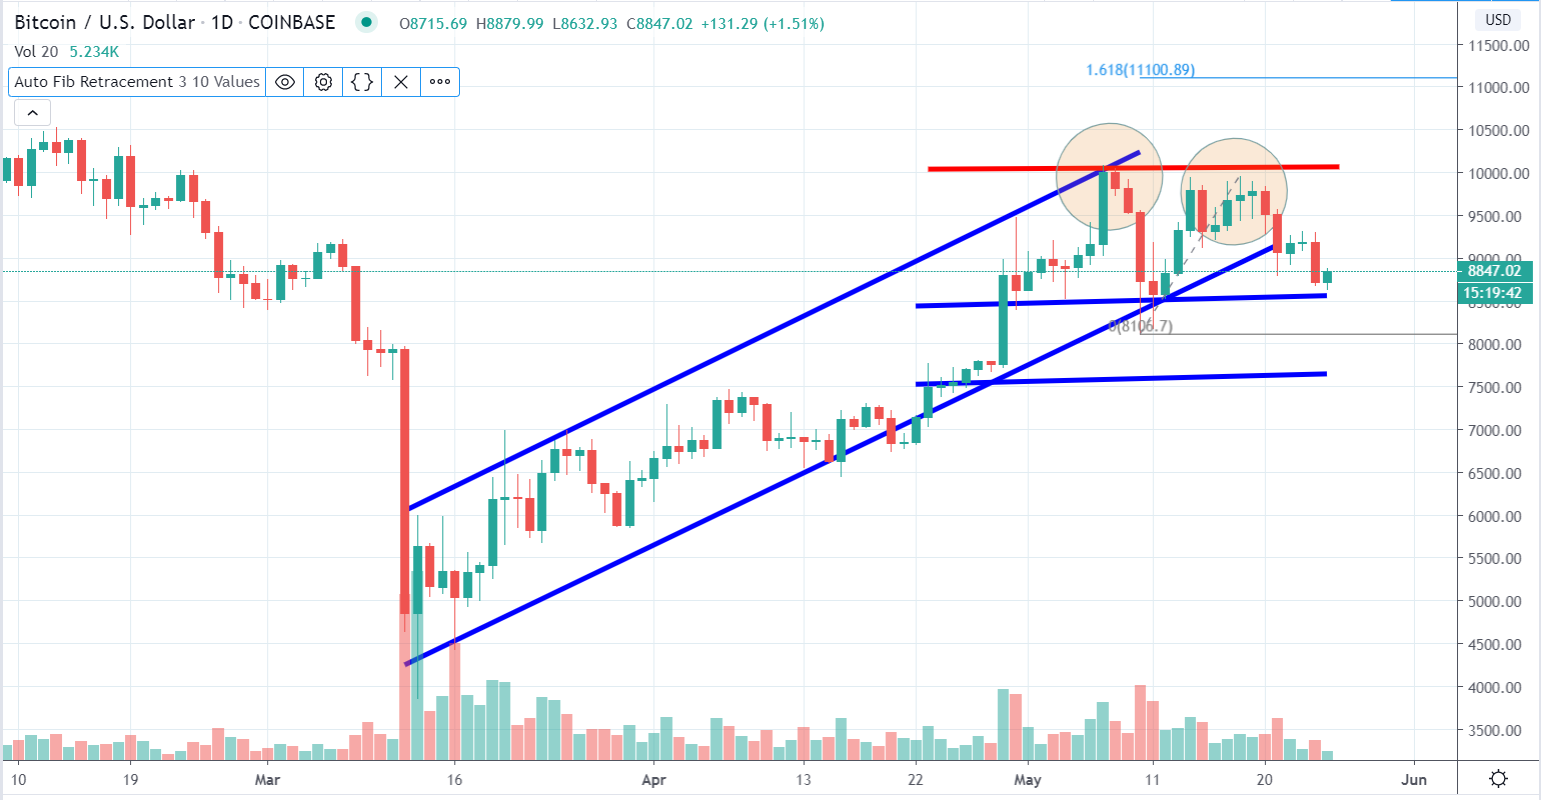
The descending trend continued over the weekend, meeting the first support level at $ 8,800 as it was expected after Bitcoin did not manage to break the $ 10,000 resistance in the previous days. Many analysts expect that the downtrend will continue in the next period, by falling from support level to support level. The next major support level for Bitcoin is the $ 7,600, created in late-April.
The two upper triangles are compatible with the three bottoms, shaped since late-April. This could become a bullish signal for the next days and if the support level does not break in the next days. The possibility for the triple bottom signal should be accompanied for a larger volume, which new is in decreasing mode.
Regarding the Fibonacci retracements, we can observe two points. The first point is the value = 0, in $ 8,100 could be considered as a conservative approach for a median support level that could be formed in the near future. The second point is on the value = 1.618 (the golden ratio) in $ 11,100, a possible outcome if the bulls win in the next period. The Fibonacci retracements should be used when there is uncertainty in the market to develop possible outcomes regarding the next moves.
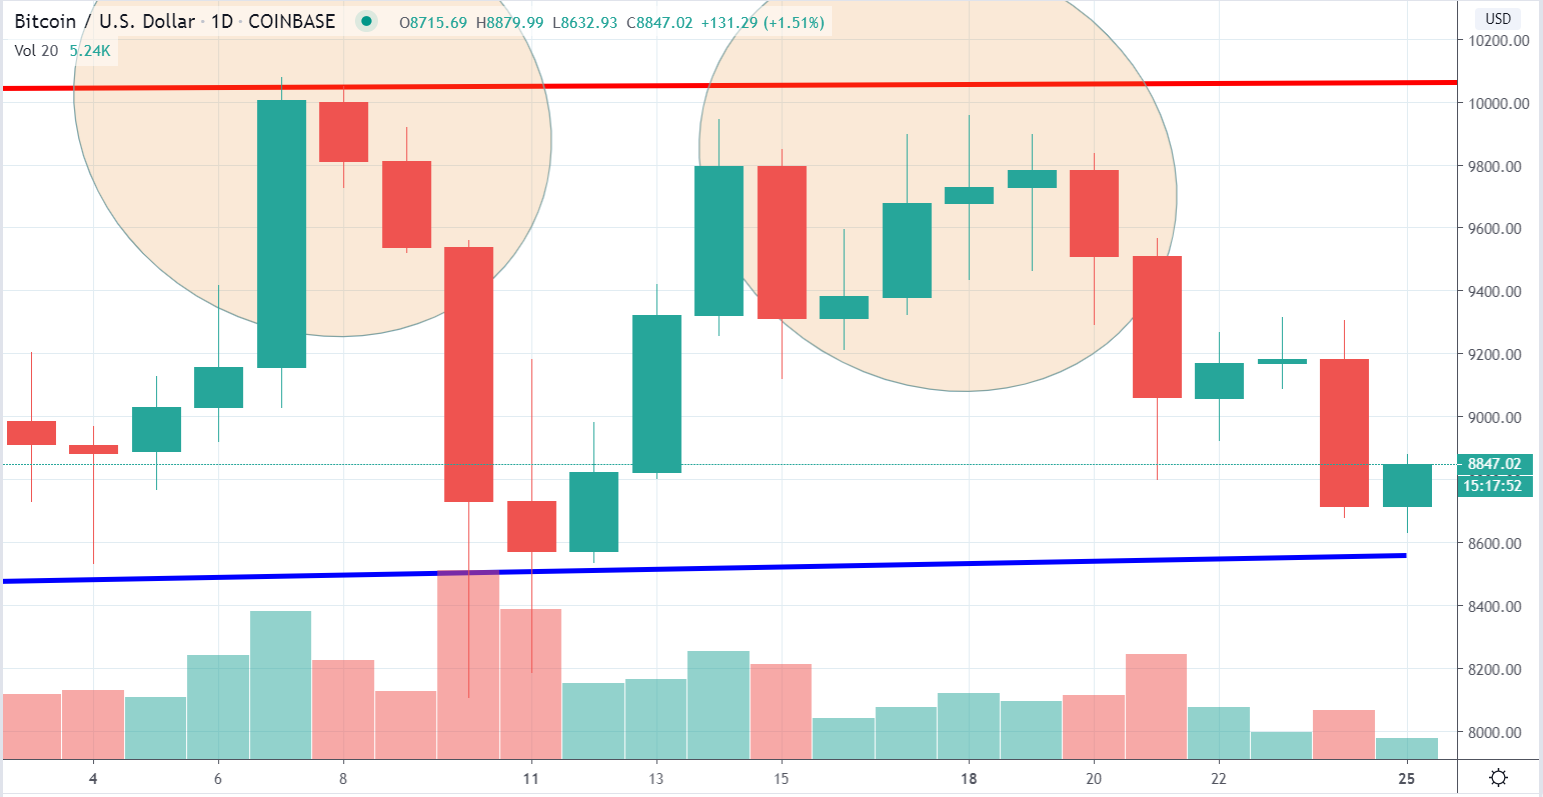
In the short-term diagram, we can observe that the price is moving between the parallel channels, with boundaries in $ 8,600 and $ 10,000. The continuous movements between parallel channels often predict a sharp move either uptrend or downtrend, according to the aggregated volume. We see that the volume is decreasing during the last weeks, a trend that could absorb power for next moves.
Indicators
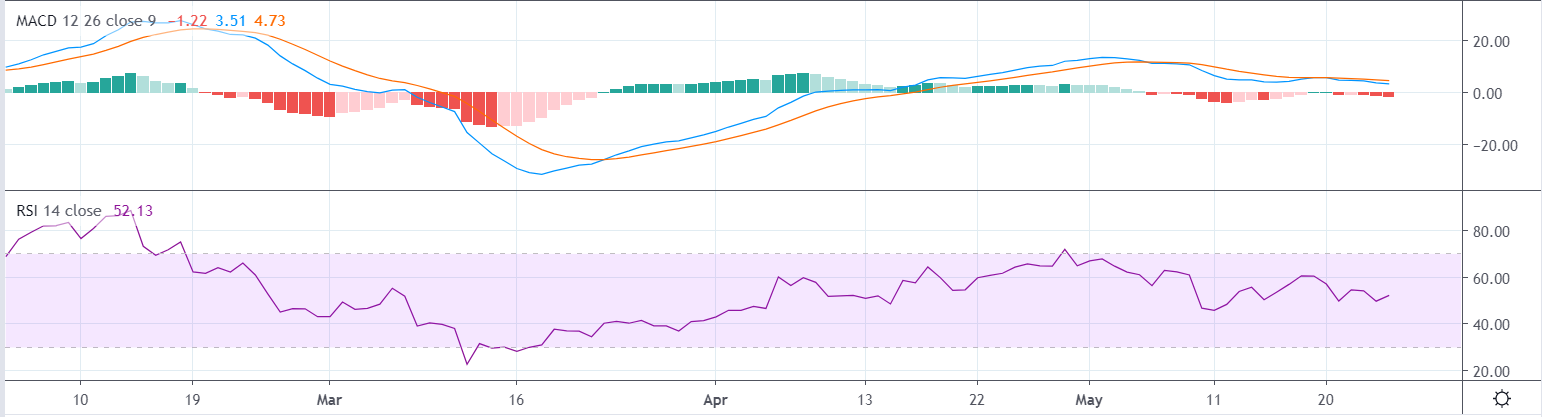
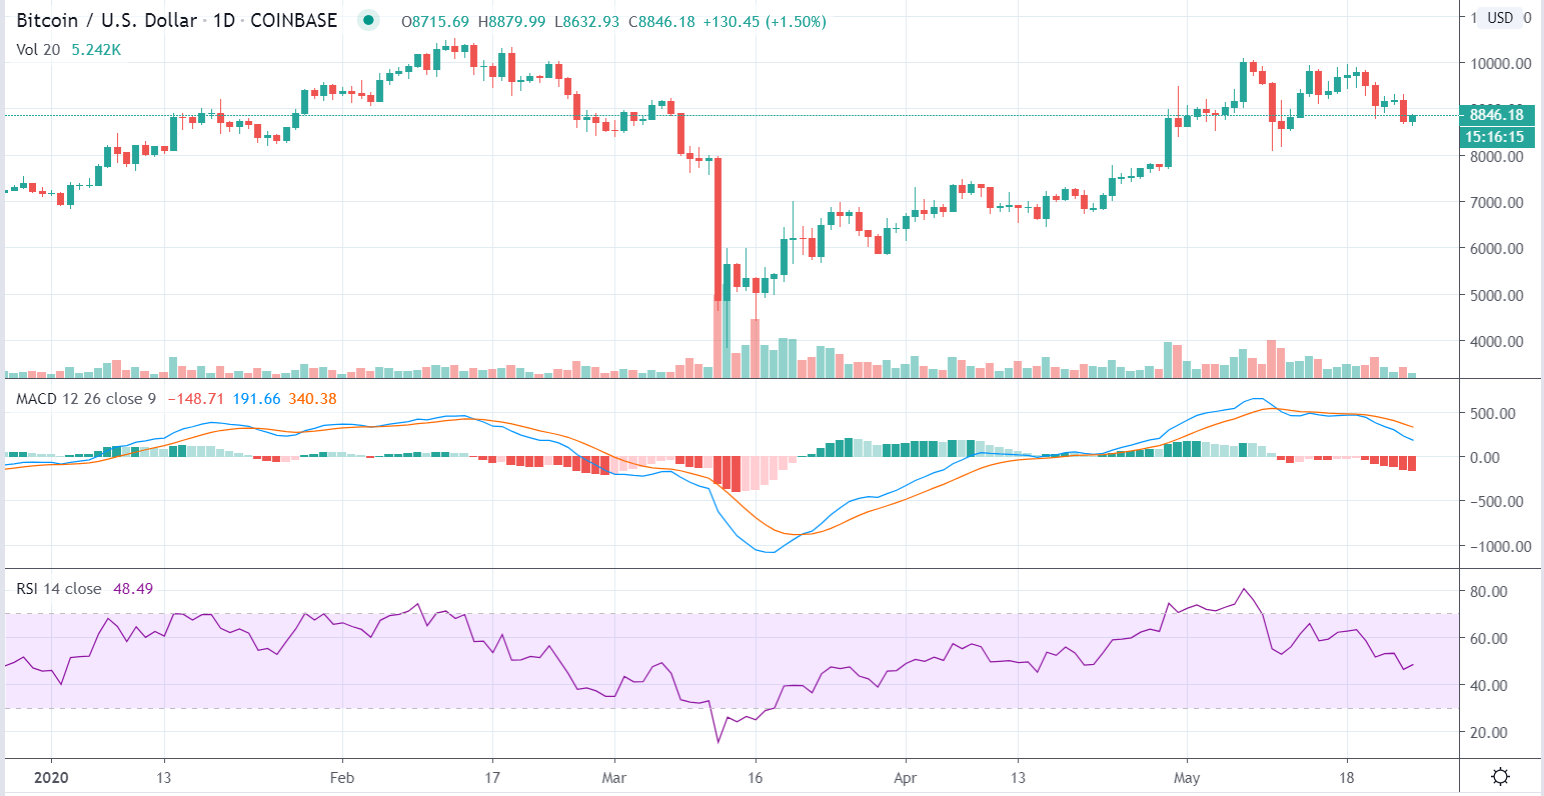
MACD index has clearly moved to a negative momentum for Bitcoin, moving even more towards the zero lines. In parallel, the RSI index is on descending move at the same levels since mid-February, showing that a possible bearish trend could be formed in the foreseeable future.
Ethereum / US Dollar
Price Analysis
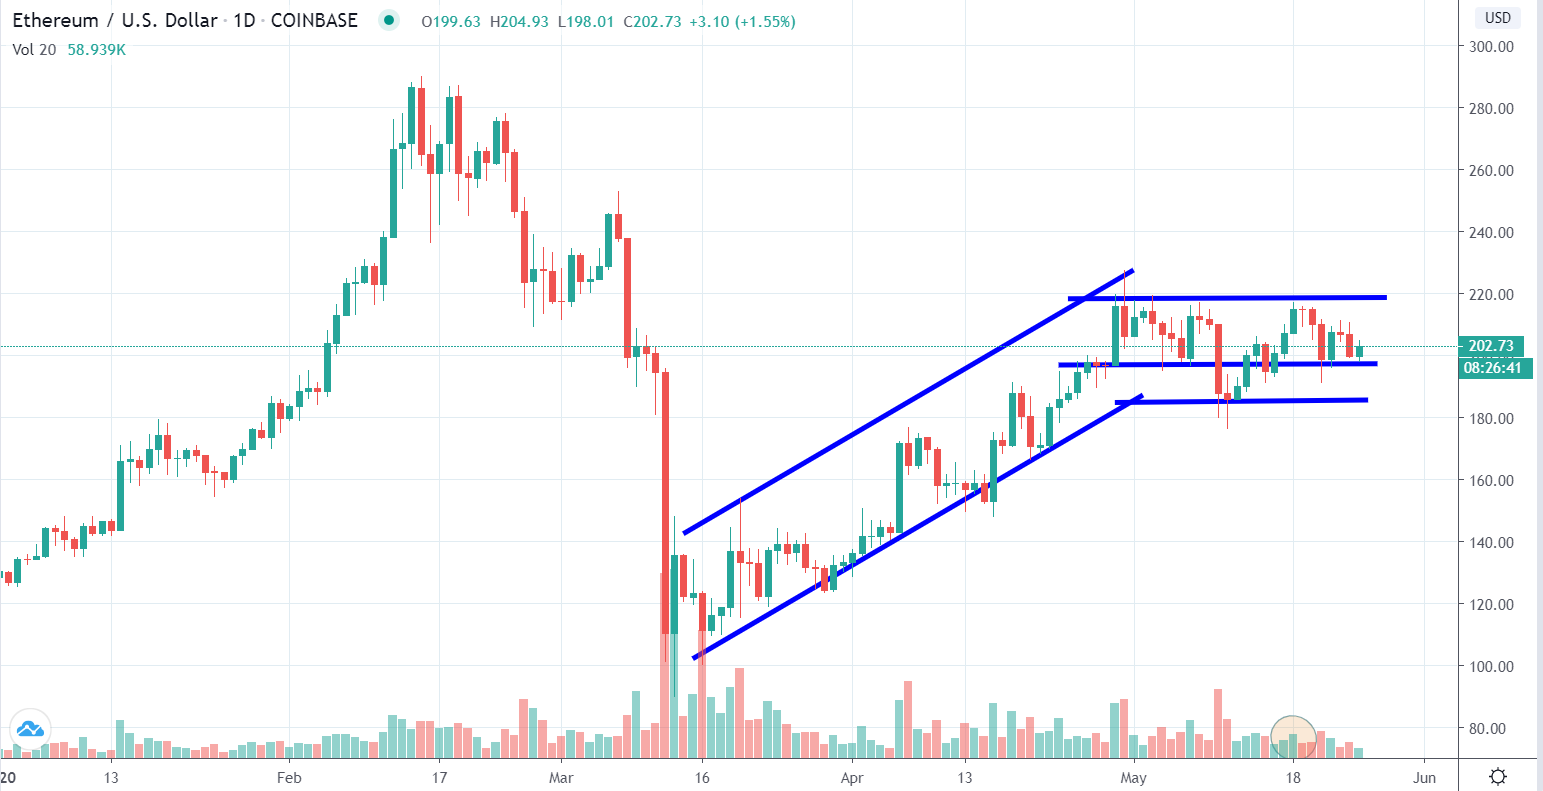
Ethereum's price slightly decreased during the weekend, remaining at the $ 200 support level. If the downtrend continues, the next support level lays at $ 185, tested around 10 days ago. The parallel channels between $ 200 and $ 220 could be tested at any moment, giving the fact that the volume is rather low.
An important factor in Ethereum' s price is the correlation between it and Bitcoin's price. In the diagram below, we can observe that the correlation was moving above 0.8, a positive and important correlation. In the past days, the correlation was decreased below 0.4 but it continues to rise until today, creating new facts for our analysis.

Indicators
MACD index is moving near 0, with a decreasing trend line, a piece of evidence that the momentum is slowing down and creating a bearish signal for the next periods. In parallel, the RSI index is moving near 50, showing no evidence for future moves.