
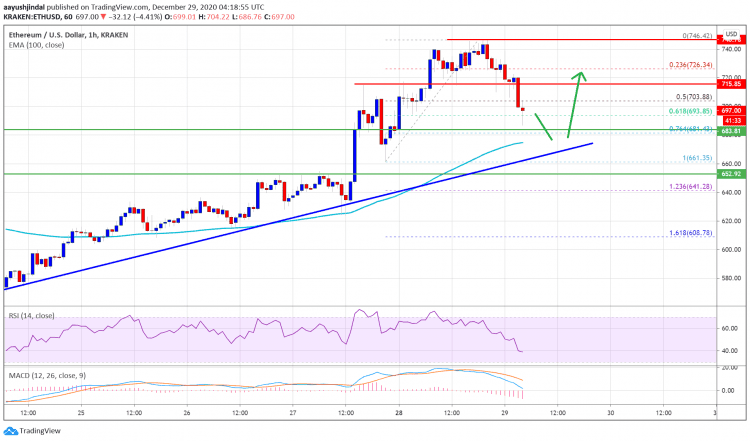
Ethereum traded to a new yearly high at $746 before starting a downside correction.
The price is now trading close to $700, but it is above the 100 hourly simple moving average.

The price is now trading close to $700, but it is above the 100 hourly simple moving average.
Major Signals
- A bullish trend line forming with support near $675 on the hourly chart of ETH/USD.
- An initial resistance on the upside is near the $715 level.
- The price even spiked above the $740 level, but it failed to test the $750 mark.
The pair could resume its upward move as long as it is above $684 and $675.
There were additional gains in Ethereum above the $720 resistance level. ETH price gained momentum above the $730 level and settled well above the 100 hourly simple moving average.
A new yearly high was formed near $746 before ether price started a downside correction. There was a strong decline in xrp, which is dragging both bitcoin and ether lower.
The price corrected below the $720 support level. There was also a break below the 50% Fib retracement level of the upward move from the $661 swing low to $746 high.
The first key support on the downside is near the $684 level. It is also close to the 76.4% Fib retracement level of the upward move from the $661 swing low to $746 high. Moreover, there is a major bullish trend line forming with support near $675 on the hourly chart of ETH/USD.
The 100 hourly SMA is also close to the trend line support and $670. Any more losses could lead the price towards the $650 support.
If ethereum stays above the $684 support or the trend line, it could start a fresh increase.
The first major resistance is near the $720 level. A clear break above the $720 level may perhaps increase the chances of a fresh bullish wave. In the stated case, ether will most likely test the $750 resistance level.
What’s your opinion on ETH’s price push-and-pull?



