New to Crypto? Don't worry if those charts look like a foreign language! Even experienced investors can get lost in the Crypto world's ups and downs. But understanding charts is like having a secret map to finding your way. Let's break it down together. We'll explore different chart types, what those lines and candles mean, and some helpful tools to guide you. By the end, you'll be well on your way to reading Crypto charts like a pro!
1. Why Reading Crypto Market Charts is Essential?
Understanding how to read Crypto market charts is crucial for anyone looking to trade or invest in Crypto. Charts provide a visual representation of market data, showing price movements over time. They help traders identify trends, make predictions, and develop strategies. By interpreting charts, you can gain insights into market sentiment, recognize potential entry and exit points, and ultimately make more informed decisions.
See more: What Does Bitcoin Price Charts Tell Traders?
2. Types of Crypto Market Charts
Each of these charts serves a specific purpose and provides different kinds of information to traders and analysts.
2.1. Line Charts
Line charts are the simplest form of market charts. They display the closing prices over a set period, connected by a continuous line. This type of chart is useful for providing a quick snapshot of overall trends and price movements. However, it lacks detailed information, such as opening prices, highs, and lows.
2.2. Candlestick Charts
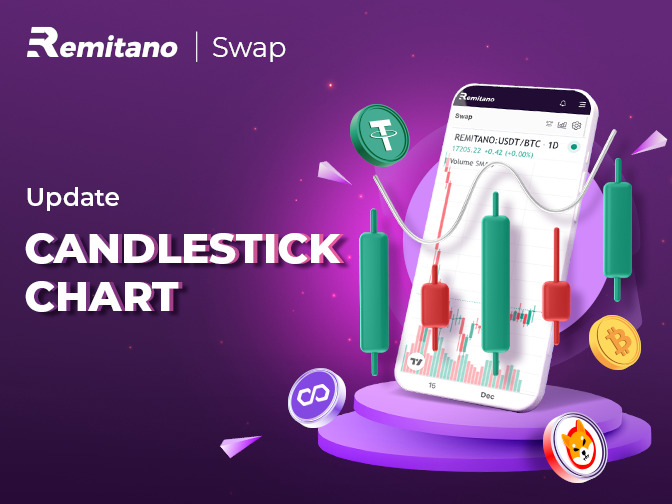
Candlestick charts are the most popular among Crypto traders due to their detailed and visually informative nature. Each 'candlestick' represents a specific time period and shows the opening, closing, high, and low prices. The body of the candlestick indicates the range between opening and closing prices, while the wicks (or shadows) show the highs and lows. Candlesticks can be color-coded to indicate whether the price moved up (typically green) or down (typically red) during the period.
Since December 31, 2022, Remitano Swap has made changes to the candlestick chart and given users easy-to-use tools for analyzing BTC USD charts and other coin pair charts.
2.3. Bar Charts
Bar charts, like candlestick charts, provide detailed information about price movements. Each bar represents a specific period and shows the opening, closing, high, and low prices. The vertical line of the bar represents the price range, while the horizontal lines on the sides indicate the opening (left) and closing (right) prices. Bar charts can help traders identify trends and price patterns.
Each type of chart has its advantages depending on the level of detail and type of analysis required by traders or analysts in the Crypto market.
3. Key Elements of Market Charts
Market charts provide valuable information for traders and analysts to make informed decisions. Let’s explore the key elements typically found on market charts:
3.1. Price Action
Price action refers to the movement of prices over time. It is a fundamental aspect of market analysis and helps traders understand market behavior. By observing price action, traders can identify trends, support, and resistance levels, and potential reversal points.
3.2. Volume
Volume indicates the number of shares or contracts traded in a given period. It is a critical component of market charts, as it shows the level of interest and activity in a particular asset. High volume often accompanies significant price movements, while low volume can indicate a lack of interest or consolidation.
3.3. Timeframes
Timeframes refer to the specific period represented by each unit on a chart. Common timeframes include minutes, hours, days, weeks, and months. The choice of timeframe depends on the trader's strategy and goals. Short-term traders might focus on minute or hourly charts, while long-term investors might prefer daily or weekly charts.
Understanding these key elements allows traders and analysts to interpret market behavior, identify trends, assess market sentiment, and make decisions based on data-driven insights from the charts.
4. Technical Indicators for Crypto Analysis
When buying and selling Crypto, it's essential to consider the role of technical indicators. These tools are crucial for analyzing crypto markets and making well-informed trading decisions. Here are three widely utilized technical indicators for Crypto analysis:
4.1. Simple/ Smoothed Moving Averages (SMA)
Simple Moving Averages (SMA) calculate the average price over a specific number of periods. SMAs help smooth out price data and identify trends. A rising SMA indicates an uptrend, while a falling SMA suggests a downtrend. Traders often use SMAs in combination with other indicators to confirm trends and potential reversal points.
4.2. Moving Average Convergence/Divergence (MACD)
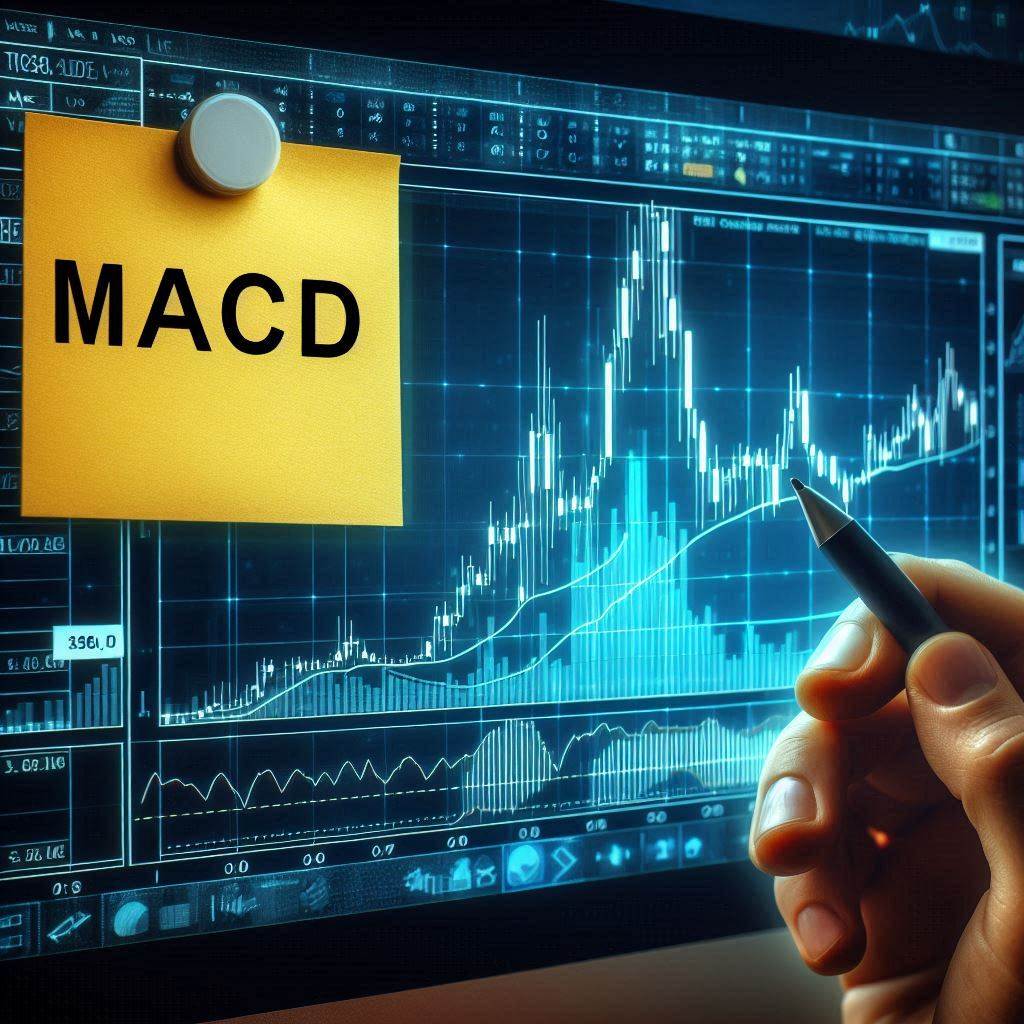
MACD is a momentum indicator that shows the relationship between two moving averages of an asset’s price. It consists of the MACD line, signal line, and histogram. The MACD line is calculated by subtracting the 26-period EMA from the 12-period EMA. The signal line is the 9-period EMA of the MACD line. When the MACD line crosses above the signal line, it is considered a bullish signal, and when it crosses below, it is considered bearish.
4.3. Relative Strength Index (RSI)
RSI measures the speed and change of price movements, oscillating between 0 and 100. It is used to identify overbought or oversold conditions. An RSI above 70 indicates that an asset may be overbought and due for a correction, while an RSI below 30 suggests it may be oversold and potentially undervalued.
These technical indicators provide valuable insights into Crypto price movements and market trends. Traders often use them in combination with other tools and analysis techniques to develop trading strategies and manage risk effectively in the volatile Crypto markets.
See more: Crypto Technical Analysis for Beginners [How-to]
5. Common Mistakes that Beginners Easily Fall For
Navigating the world of investing and trading can be challenging, especially for beginners. Here are some common mistakes that beginners often fall for:
5.1. Ignoring Fundamental Analysis
While technical analysis is crucial, ignoring fundamental analysis can lead to poor trading decisions. Fundamental analysis involves evaluating an asset’s intrinsic value based on factors such as its technology, team, use case, and market potential. Understanding both technical and fundamental aspects provides a more comprehensive view of the market.
5.2. Chasing Hype and FOMO
Fear of Missing Out (FOMO) can lead to impulsive and emotional trading decisions. Chasing hype-driven coins without proper research can result in significant losses. It's essential to stay informed and make decisions based on thorough analysis rather than succumbing to market emotions.
See more: The Psychology of FOMO and FUD in the Cryptomarket: How to Handle Emotions
5.3. Falling for Pump and Dump Schemes
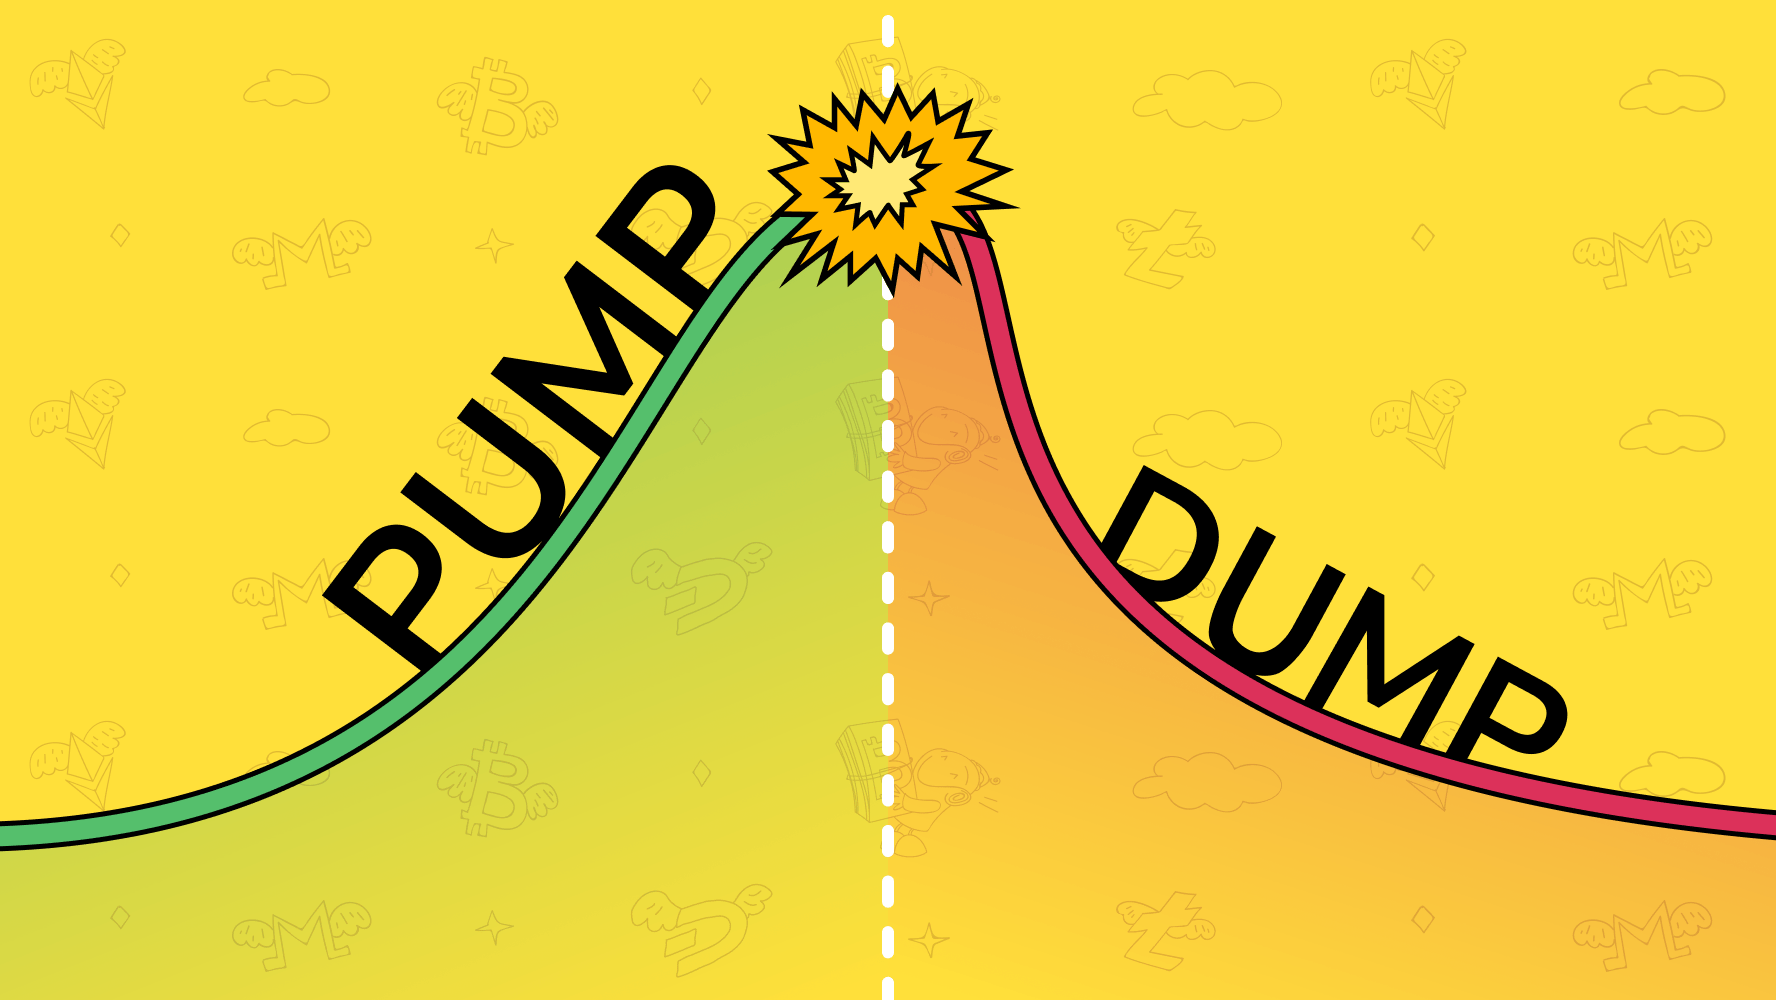
Pump and dump schemes involve artificially inflating the price of an asset through false or misleading information, only to sell off once the price peaks. Beginners can easily fall victim to these schemes. It's crucial to verify information, use reliable sources, and be wary of overly optimistic claims.
Avoiding these common mistakes involves patience, education, and a disciplined approach to investing. By conducting thorough research, understanding both technical and fundamental analysis, and being aware of market dynamics, beginners can enhance their chances of success in the challenging world of investing.
Reading Crypto market charts is a fundamental skill for any aspiring trader or investor. By understanding different types of charts, key elements, and technical indicators, you can make more informed decisions and navigate the volatile Crypto market with confidence. Avoid common mistakes, stay informed, and always base your trading decisions on thorough analysis rather than emotions or hype.
Maybe you’re interested in: