Bitcoin / US Dollar
Price Analysis
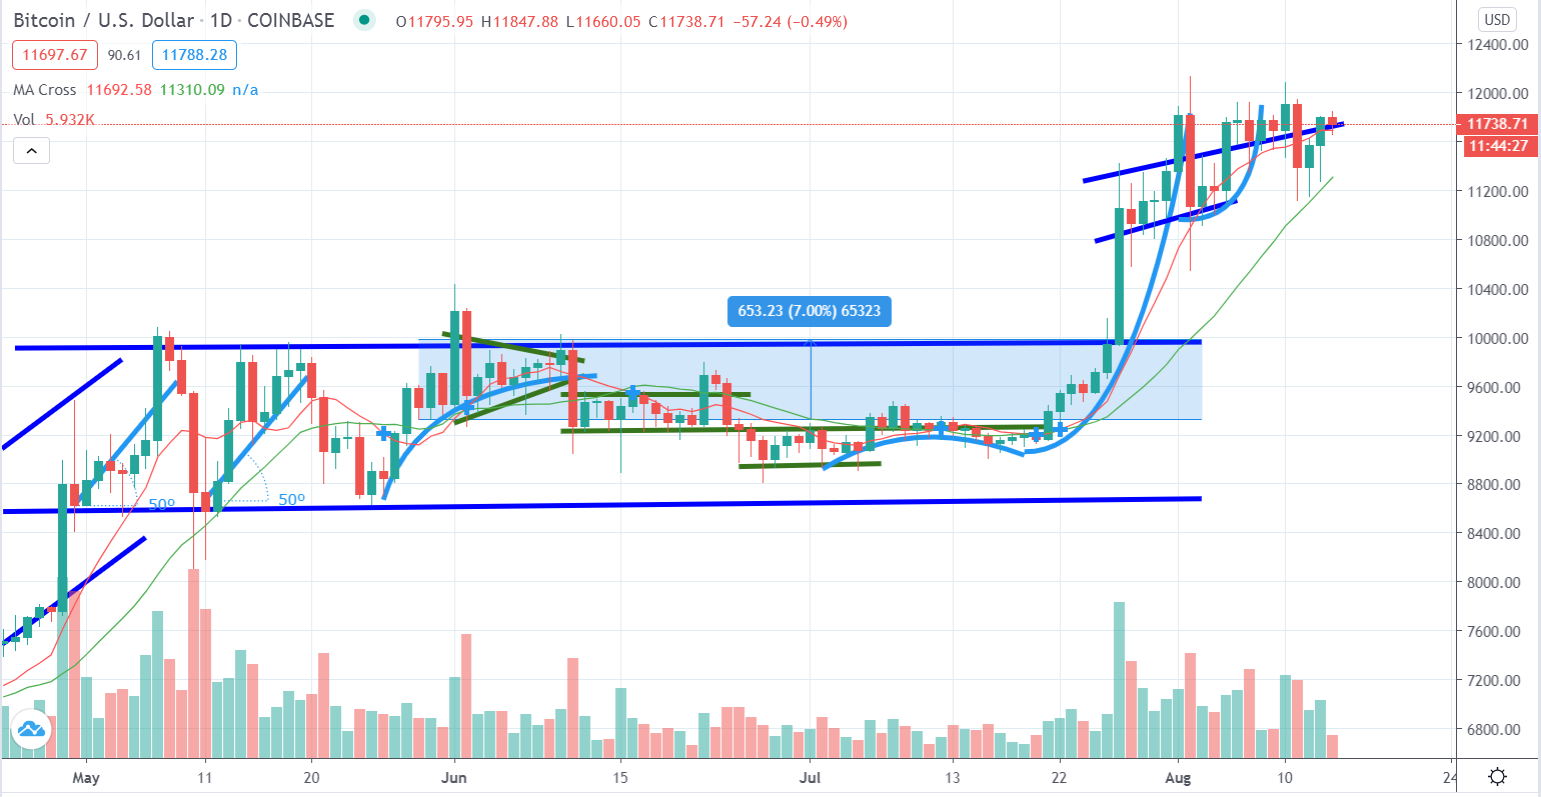
Bitcoin's price remained stable during the last few days, without major fluctuations in the market, showing that the bullish period has been paused and we wait for the next major move to happen. Even if the price didn't move very positively, the trend still remains bullish with its major components to be positive overall. This means that the bullish trend has not stopped yet but there is a temporary halt on that.
The main trend line moves to $11,750 at this moment and it is climbing at higher levels if the trend continues. We believe that if there is a small correction in the market, the price will drop in the moving support line at $11,200, without diverging from the overall bullish trend. The volume was sustained at normal levels for the period and we expect the price to move accordingly in the next days as the weekend is coming.
The moving averages are moving close to each other, creating a possibility for a reverse "Golden Cross" in the next days or weeks. We should be really careful about it as the 200-day average is climbing, without the 50-day to bend down. This means that the market has entered a period of stability that might produce fake signals from the moving averages indicators. We should also take into account that the 200-day average includes values from the previous bullish run for Bitcoin at the same levels near January.
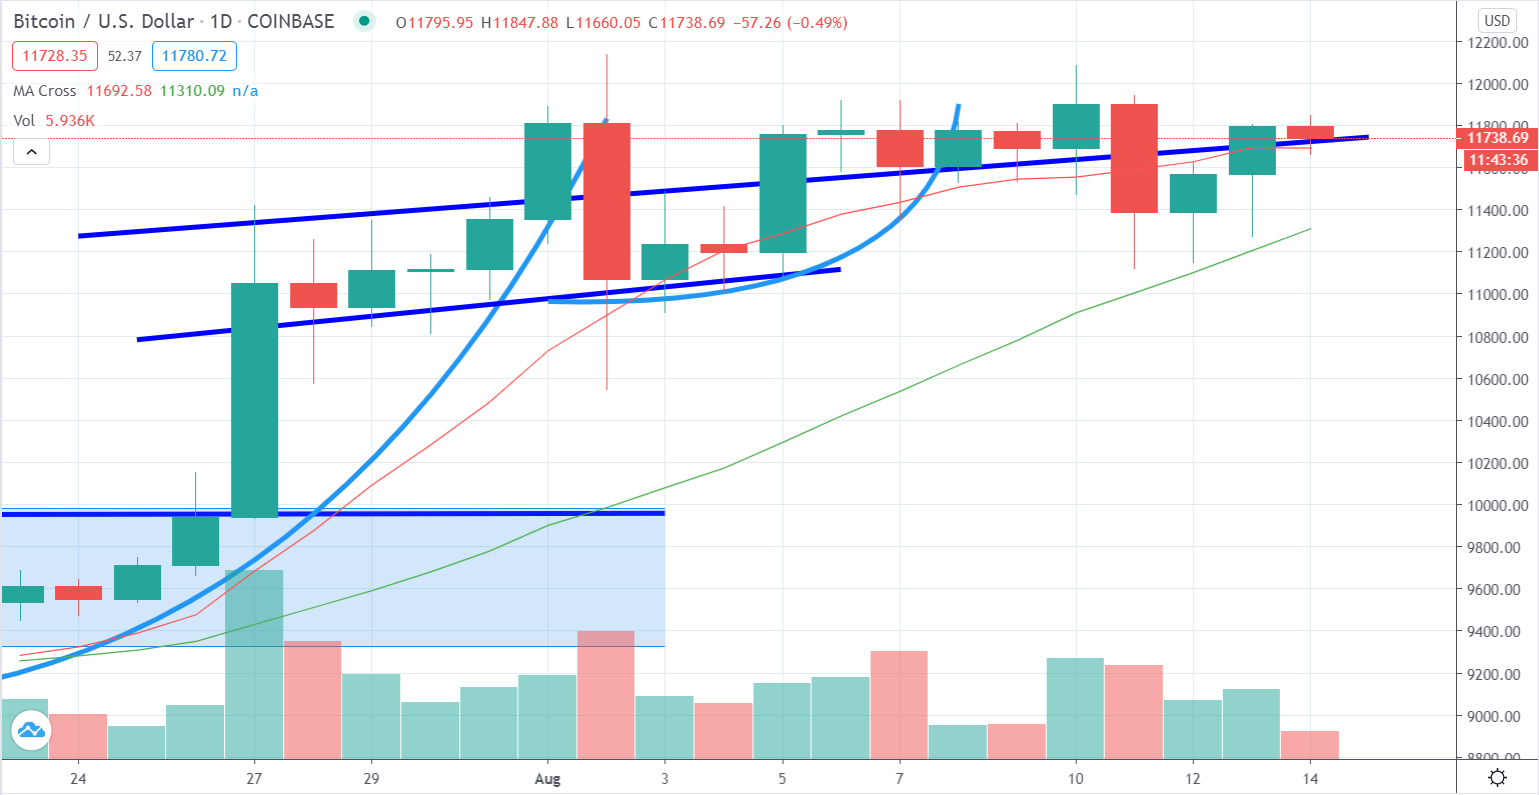
In the short-term diagram, we can observe that the short-term period for Bitcoin's price has larger volumes overall, meaning that many investors enter the market or increase their positions in the market. On the other hand, investors that claimed their profits and liquidate their positions were a smaller percentage in the market and didn't overthrow Bitcoin's effort to climb the price ladder.
Indicators
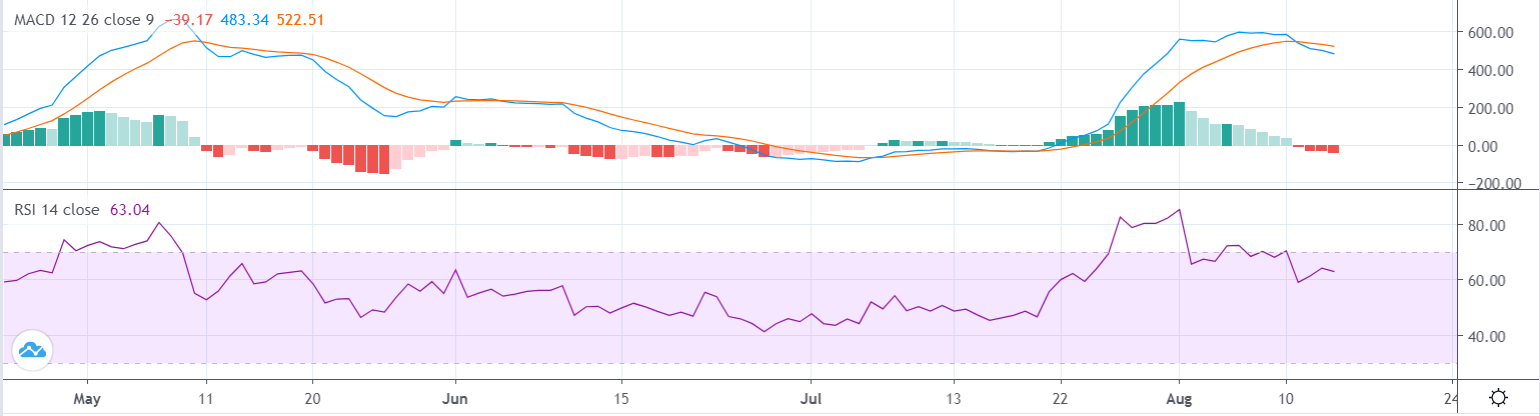
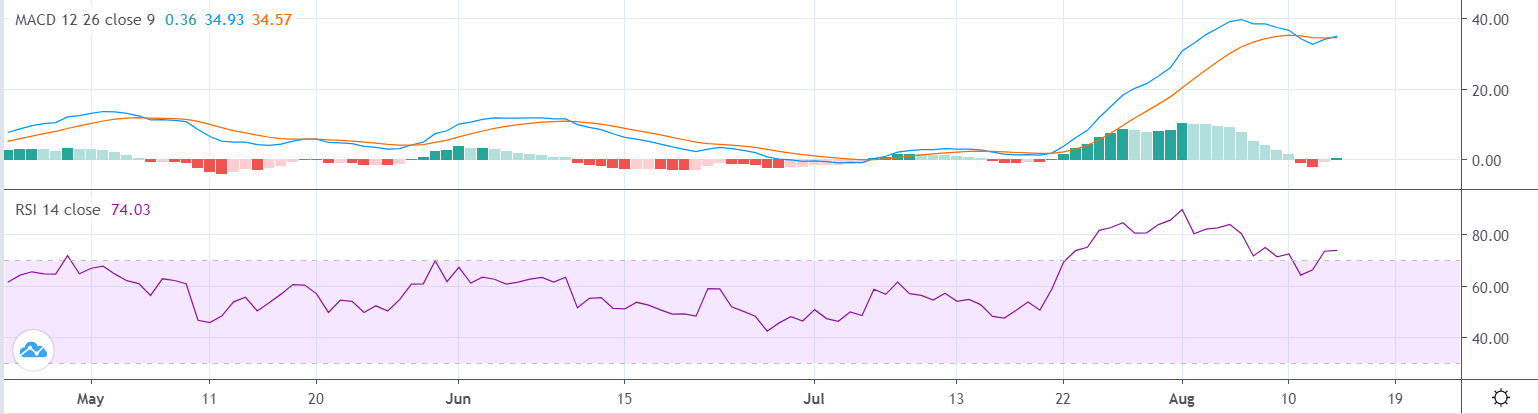
MACD index remained on the negative side, showing that the momentum in the market is not so effective in terms of market drivers. In periods when the momentum is the key market driver, we can expect higher correlations between the MACD index and the next day's price. The RSI index is on value = 63, showing that a sudden uptrend will create another "sell" signal for the investors.
Ethereum / US Dollar
Price Analysis
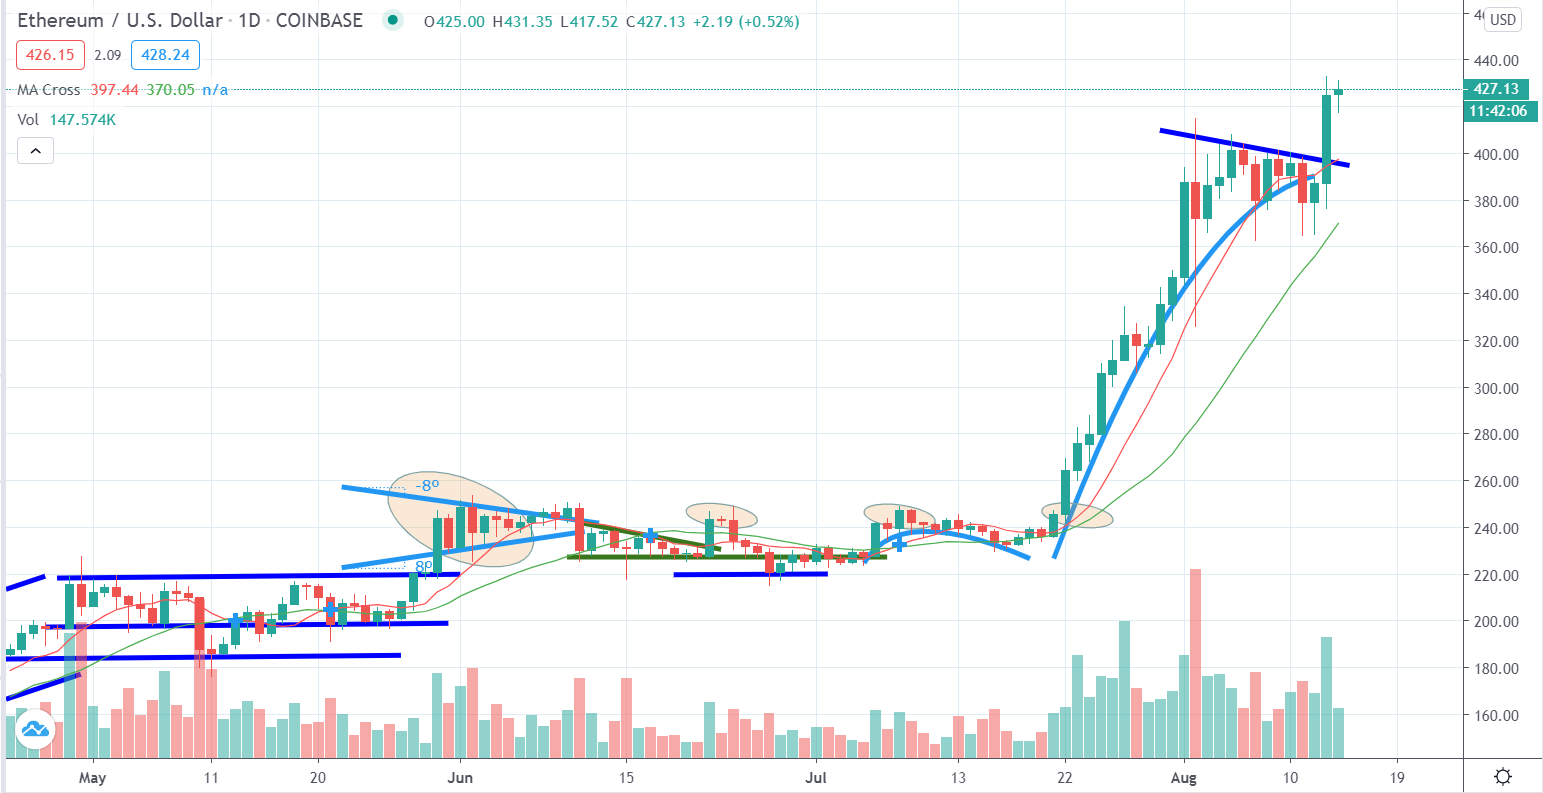
As we have mentioned several times in those articles last month, Ethereum is always a nice surprise for anybody in the crypto world. Even if the trend was moving towards lower support levels, the price jumped almost 8 % during a day and laid at $425. By this jump, Ethereum proved that the bullish period still continues to exist and create hopes for more investors that might consider exiting the market by claiming their profits. The $400 resistance level was another factor that creates a barrier in the market to grow quickly but it also broke during the day. We should see if this boom can be sustained in the market or the price will correct back to the previous levels, below $400. It's early to see if the price will remain as there is no market depth to support this fact.
The moving averages are moving apart after the price jump, keeping the probability for a reverse "Golden Cross" much lower than in other markets.
Indicators
MACD index moved back again on the positive side, showing that the price jump was enough to reverse the momentum in the market at a single move. The momentum reversal might disappear at any moment as the market status is still fragile. The price jump caused also the RSI index to move back to the "overbought" area, showing that the market has experienced a tremendous expansion over the last month, indicating that a reverse move might close the market circle in a steeper way.
Ripple / US Dollar
Price Analysis
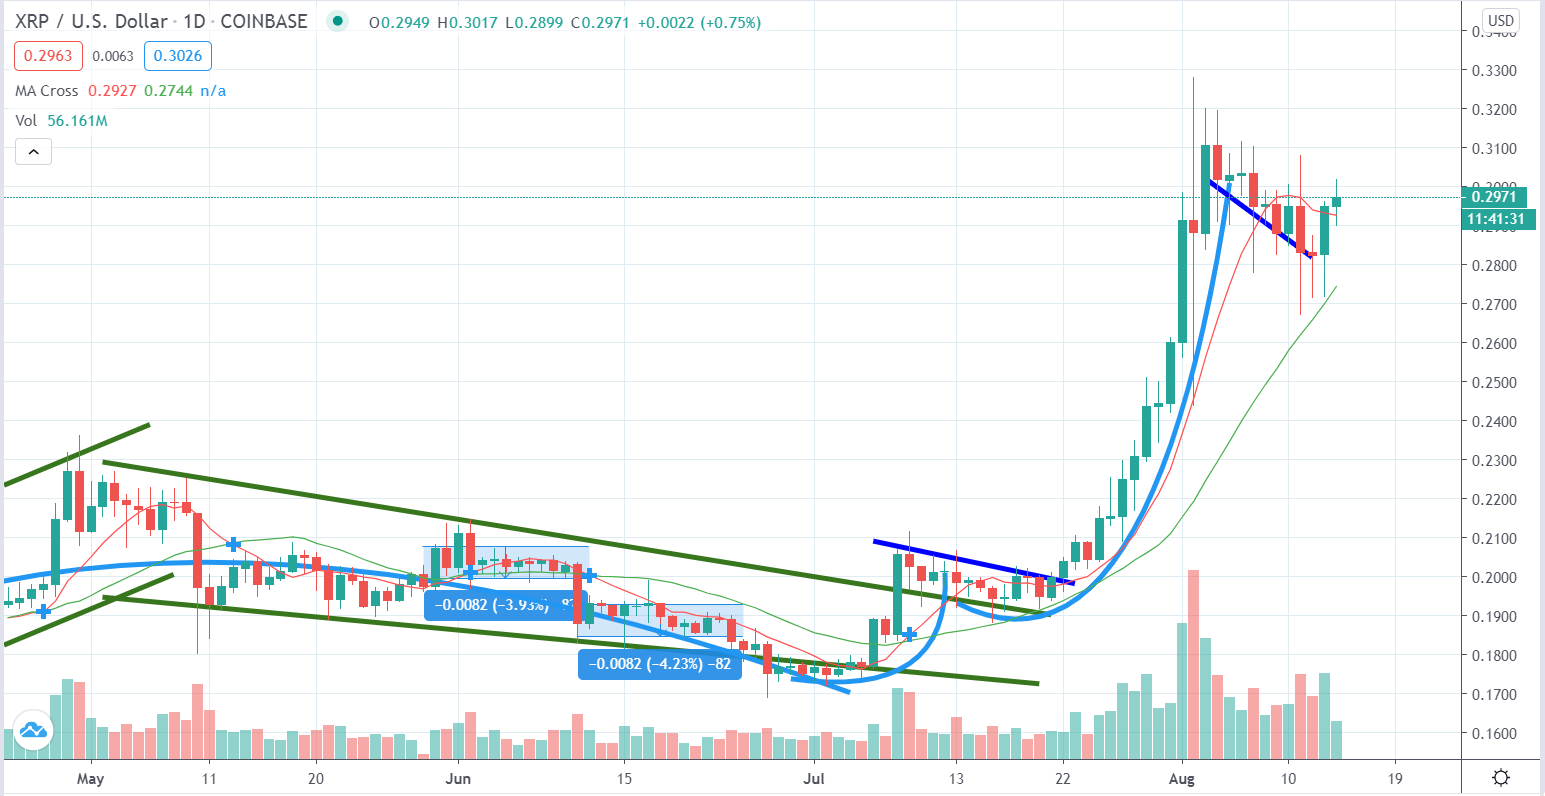
Ripple has also a positive day, moving from $0.28 to $0.30. The small boost in the market has not managed to reverse the bearish trend that was created 10 days ago but it definitely makes the market balance for a little, waiting for the next move to happen. The bearish trend is moving between $0.28 and $0.29, a narrow path following a downtrend direction.
The volume moved at normal levels for this period, creating enough depth for the current situation to sustain a normal level of trading activity. Many analysts are worried about the lack of depth in the Ripple's market, which may prove a weakness in a bearish trend. The moving averages are moving closer to each other, with the 50-day average to remain steady and the 200-day average to climb at a fast pace.
Indicators
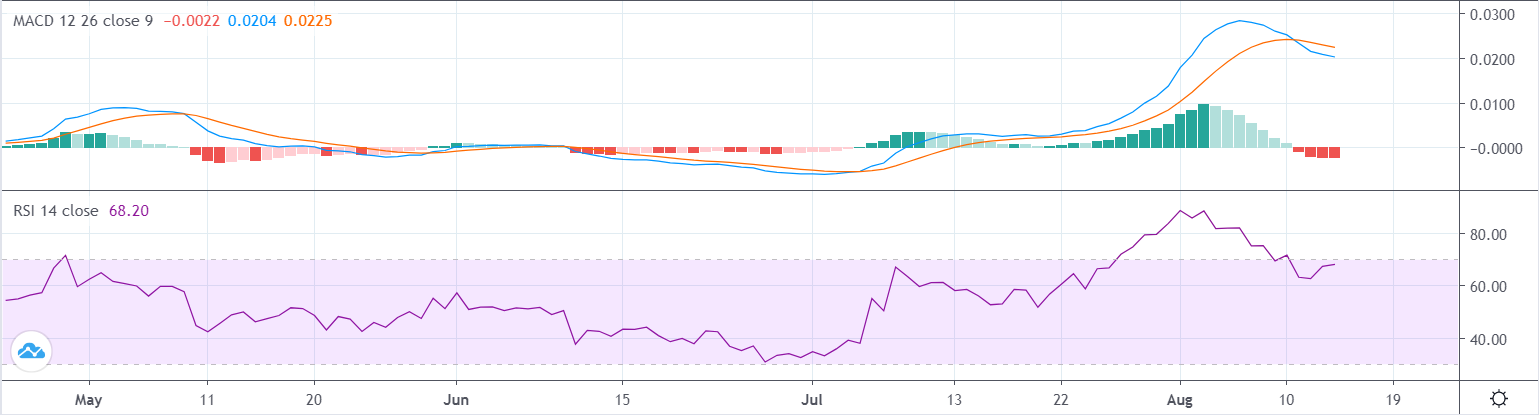
MACD index remained at the negative side, showing that the price boost was not enough to reverse the market momentum. We should observe the market to find out if the momentum will be affected by the recent boost and act according to that. The RSI index still moves in the "safe" zone but the recent price jump made this signal quite fragile as it moves back towards the "overbought" area.
Litecoin / US Dollar
Price Analysis
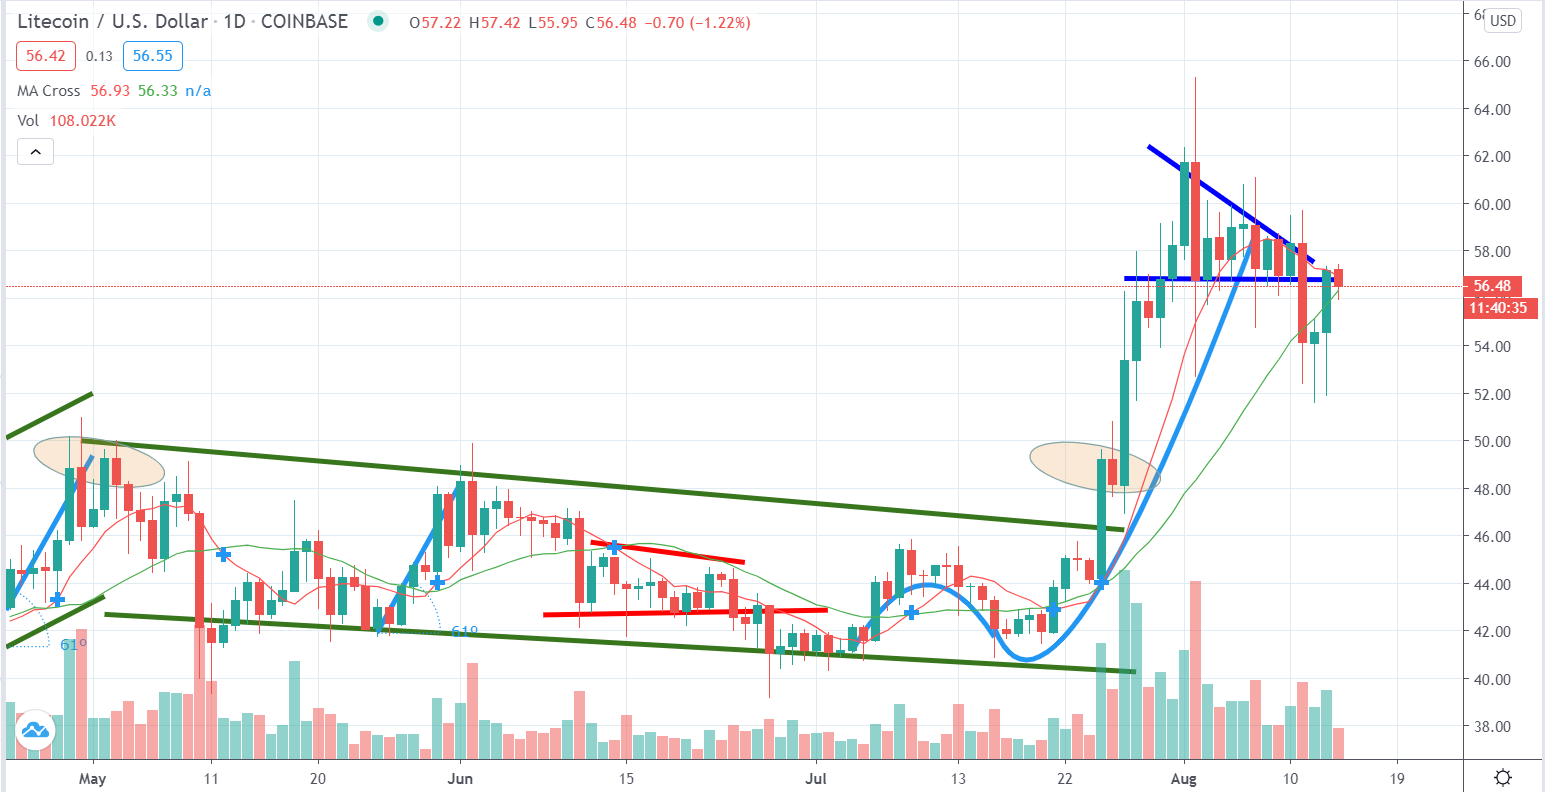
Litecoin took one of the hardest hits regarding the correction, which happened during the previous days. For this reason, the price jump didn't make any difference in the market as something new like in other cryptos but it looked like a corrective move to the previous correction. The ups and downs for the Litecoin market seem to confuse many investors and take different positions in the market. The critical level for Litecoin is at $57, which served both as a resistance and support level for the bullish and bearish trend.
The $57 point will determine the direction for the next trend in the Litecoin market as the rest crypto market will affect it. The volume moves at normal levels for the period but we have to note that it is lower than expected regarding the price movements and their steepness. The moving averages are really close to each other and a potential reverse "Golden Cross" might occur during the next days. At this point, we should be very careful as even if the 50-day bend for a little, the 200-day average has climbed to the current price levels, creating weak signals for the investors.
Indicators
MACD index is moving on the negative side, showcasing that the bullish period is over for Litecoin and the momentum effect will not last for long. The RSI index still remains below value = 60, showing that the price might remain at the same levels for the upcoming days without major moves to happen in the market.
Bitcoin Cash / US Dollar
Price Analysis
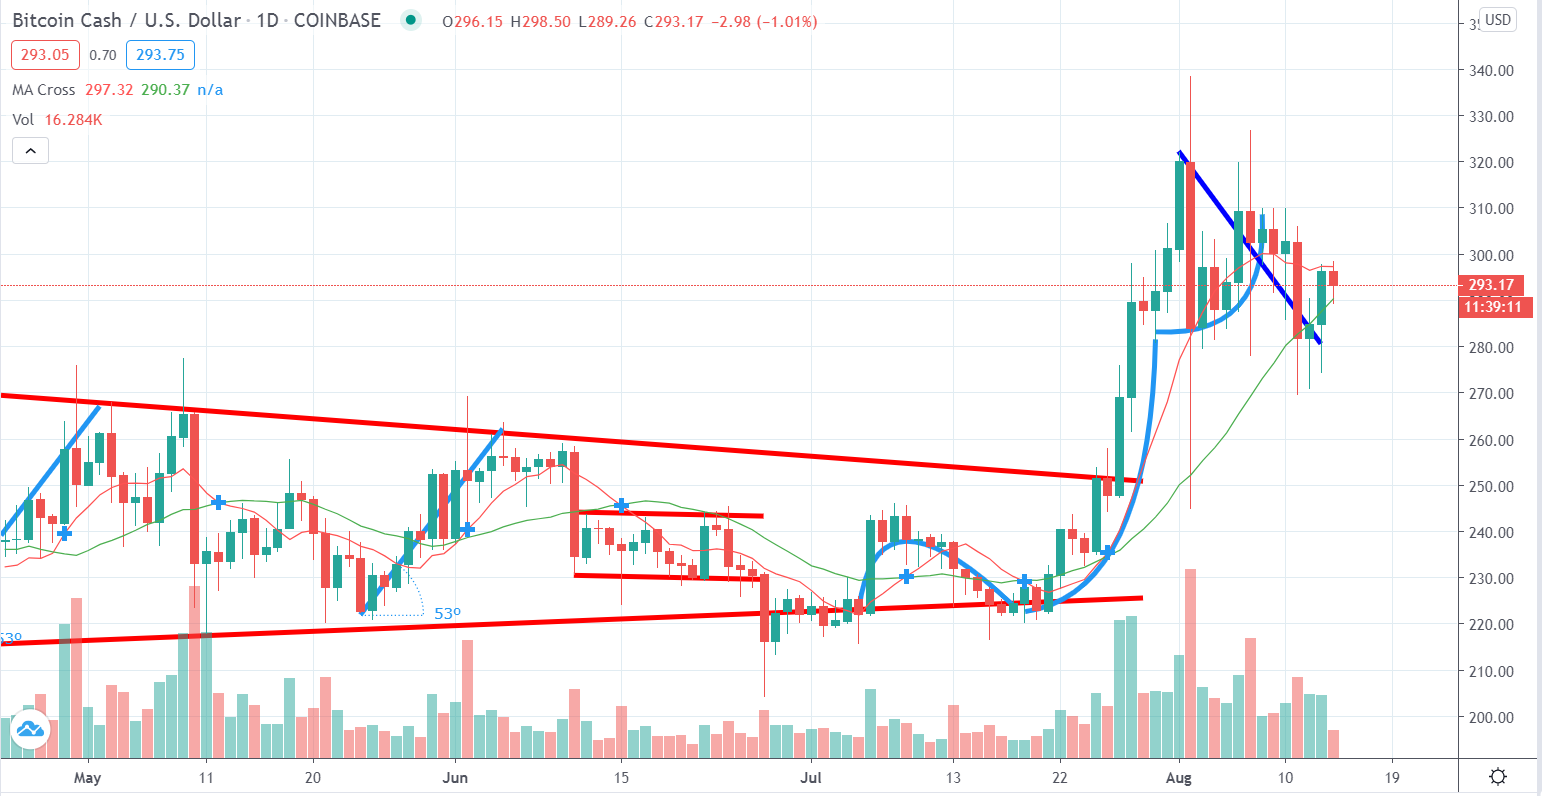
The same picture with Litecoin can be shown in the Bitcoin Cash market. The bearish trend moved at $280 and then, there was a small bounce up to $295, following the established trend in the rest crypto market. The bearish trend in the market started a week ago and shows that most cryptocurrencies follow the same direction.
The volume remained at lower levels, regarding the price moves but it would help to establish the price if the market moved in the opposite direction. Bitcoin Cash is considered to be one of the most dependent cryptos with the rest market, meaning that an overall turn in the market, either upside or downside, will affect the Bitcoin Cash market regardless of the technical signals or the indicators. This is why we should study the entire crypto market before we decide how to invest and where we are going to position our money.
Indicators
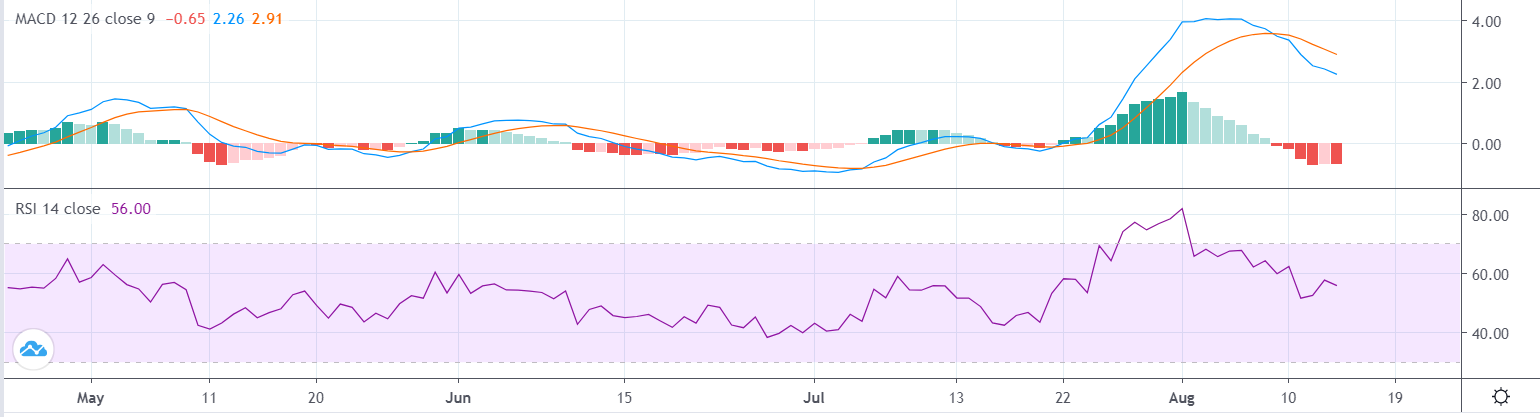
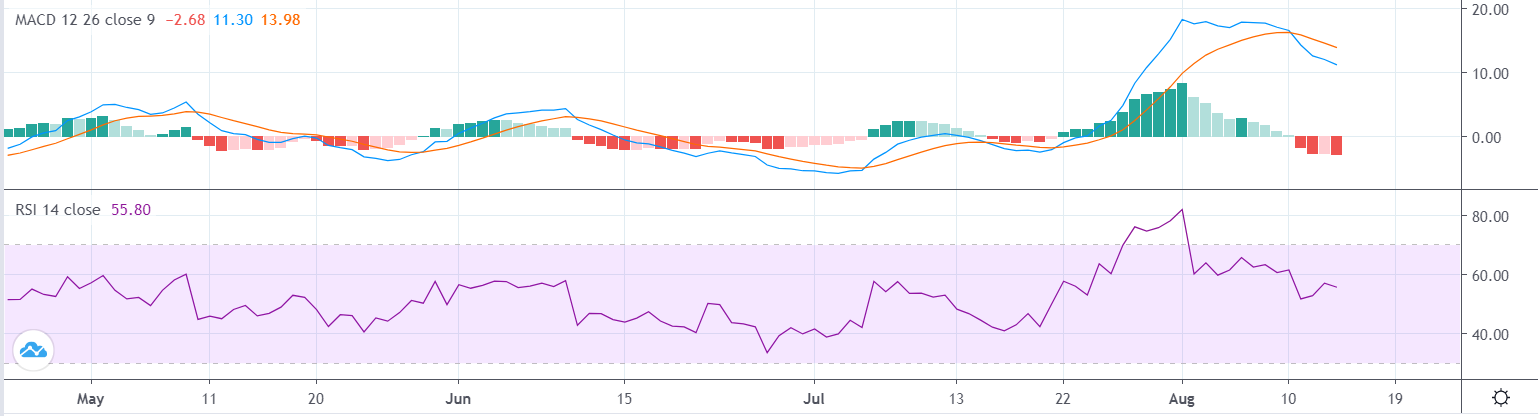
MACD index remained at the negative side, showing that the market momentum could affect the market position, regardless of investments' decisions for their next moves. The RSI index moves at values between 50 and 60, showing that the market will move at a stable pace during the next days.
Correlations
Bitcoin / Ethereum = 0.80 (- 0.07), Bitcoin / Ripple = 0.77 (- 0.07), Bitcoin / Litecoin = 0.78 (- 0.13), Bitcoin / Bitcoin Cash = 0.83 (- 0.10)
The correlations dropped even more during the last day, showcasing that the market is disintegrated and the altcoins start to move independently from Bitcoin. This fact can be proved from the point that Bitcoin remained stable during the last days while the majority of the cryptocurrencies were bouncing back since the last drop in the market. What we observe is that a sudden drop in the market creates a sales offer for many investors, that decide to invest smaller amounts of money in altcoins due to smaller market caps. As we have mentioned before, currencies with a smaller market cap can be manipulated more easily from a larger one. In addition, cryptocurrencies with smaller prices can have larger returns over the bullish periods as the percentage of the move could lead to higher returns.





