As of 21st October, the Bitcoin price, as indicated by the chart, stands at $62,809 ( a price dip over $3,000), which is a result of investors taking out profits; this price fall translates to a 4.87% loss in the last 24 hours.
The chart above shows a visible sell-off happening in the market, indicated by an increased bearish candle and sell volume. With Bitcoin attaining new all-time highs in less than 24 hours, we expected that BTC bears would attempt to bring the price down, which in conjunction with individuals scrambling to take profits led to the drastic price fall.
Currently (22nd October), Bitcoin trades at $63,455, with a 24-hour price loss of 3.13%, marking a gradual price recovery. The seven-day price change still stands positive at 7.49%.
With this price movement, we can expect the Bitcoin price to hit $100,000 by the end of the year, or higher by the end of this bull-run
Indicators

From the October 22nd relative strength index chart, we can see a huge sell-off happening immediately Bitcoin got in the overbought zone, which is expected as individuals take out profits from the price pump. The current RSI stands at 67 as the buying action seems to restart.
With the strong fundamentals backing Bitcoin, the RSI could increase, although a sell-off action could be on the cards.

The MACD over the last two days indicates a massive positive momentum in the market, placing the bulls in full control of the BItcoin market and corresponding to the relative strength index.
Ethereum / US Dollar
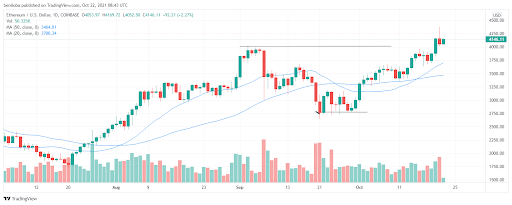
In the same light as Bitcoin, Ethereum also experienced a price run-up which saw it break the previous resistance of $4,000 to trade at $4,146, and this comes after the bears staged a push back, rejecting the Ethereum price from the $4,250 mark.
The price chart above shows an increased selling volume on the 21st of October, representing the bears rejecting the ETH price.
As of the 22nd of October, there is a noted increase in the buying volume, which could signify the bulls preparing to take on the $4,250 price tag. Eth trades at $4,146 per coin as of the writing of this price analysis, which translates to a 24-hour price gain of 2.27% and a seven-day price gain of 9.56%.
Indicators
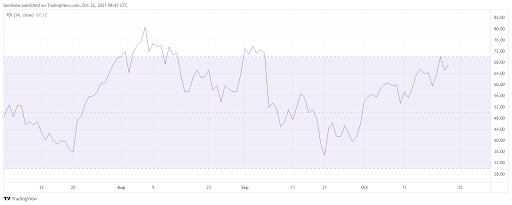
The Ethereum relative price index reflects a sell-off that happened just as the RSI hit the overbought mark.
As of the 22nd of October, the RSI notes a minute increase to put an end to the sell-off, and this corresponds to the increased buy volume noted on the price chart; the RSI currently stands at 67, which could indicate the bulls attempting to pick up steam to attack previous $4,250 price resistance.

The Macd correlates the RSI, indicating an initial breakout over the zero line; the current MACD shows strong and positive momentum in the market despite the rejection from the bears. On the 22nd of October, macd maintains this narrative, agreeing with the bulls being In control.
Ripple / US Dollar

As with several other altcoins, Ripple experienced a price pump. However, as with other altcoins, Ripple bears rejected the price on the 21st, reflected by the increase in selling volume. On the 22nd of October, the Ripple price stood at $1.10, representing a 24-hour price loss of 4.48% and a seven-day price change of -1.7%. By this, we can say the bears are gaining in on the bulls. Despite this price movement, it is believed that the Ripple court case is stalling the progress of the asset.
Indicators

The relative strength index of Ripple illustrates a slight recovery after experiencing a sell-off, which could indicate the bulls accumulating during such dips.
The current RSI stands at 52.24, which falls in the region of individuals buying into the asset. However, the purchasing strength is not stable completely as the impact from the bears could spark an increased sell-off.
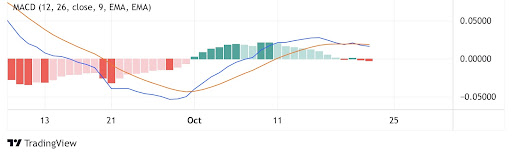
The MACD line stays over the zero line, indicating a positive outlook on the market; however, the histogram indicates a negative momentum to the market. The next few days will be important in the determination of the momentum market trend.
Litecoin / US Dollar

Litecoin, just like several altcoins, experienced price surges to get past areas of resistance, hitting a price mark above $200. However, not without resistance from the bears.
As of the writing of this price analysis, the LTC price stands at $198 per coin, representing a price loss of 5.63%; however, LTC still has a seven-day net price gain of 10%.
From the above chart, we can see the rejection by the bears from a price of $214, and we can also see an increase in the buying volume, which could mean the bulls attempting to stage a comeback.
Indicators
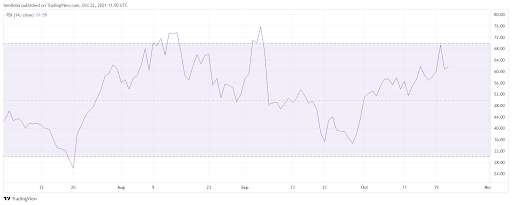
The relative strength index of Litecoin reflects the recent market sentiment; in the chart, we see a Recent sellout that occurs just as the RSI hits the overbought zone; this sellout saw the RSI fall, which corresponds to the increased selling volume recorded on the chart. The current Litecoin relative strength index stands at 61, ending the selling as the bulls rally to challenge the previous reaction.
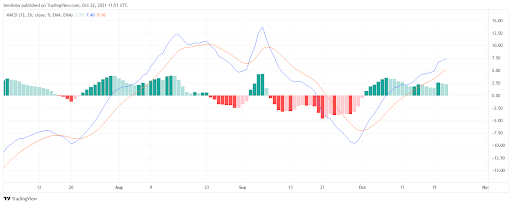
The MACD line currently trades above the zero line, which indicates a positive market momentum, placing the bulls in control of the market. Despite the price drop, the MACD corresponds with the RSI confirming a positive outlook on the market.
Bitcoin Cash / US Dollar
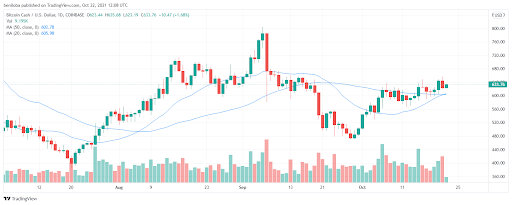
The Bitcoin Cash bulls attempted a rally up alongside several other altcoins, which saw the BCH price attempt to challenge previous resistance areas. On 21st October, the Bitcoin Cash price experienced a decline, maintaining previous areas of resistance, and this also corresponds to the increased selling volume.
As of the writing of this price analysis (22nd October), the Bitcoin Cash price stands at $633 per coin, which translates to a 24-hour price change of -1.25% and a seven-day price gain of 3.09%.
The major target of the bulls remaining is getting past the previous resistance price of, already by the increasing buy volume.
Indicators
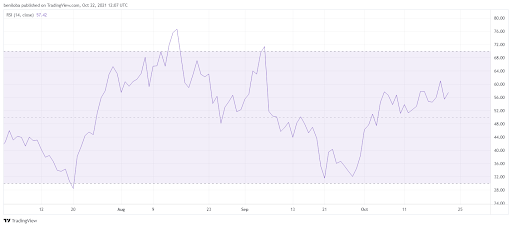
The Relative Strength Index reflects the Bitcoin RSI recovering a recent sellout (corresponding to the bears maintaining the level of resistance). The current Relative Strength Index stands at 57 which could signify an increased buying volume, and this means individuals utilized the price dip as an opportunity to increase their holdings. However, the overall market strength is seen to be positive.

The MACD line is placed above the zero line providing a positive momentum with the bulls being the main driving force. The MACD also correlates with RSI confirming the bullish trend in the market.
Cardano / US Dollar

Over the last few days, the ADA price has experienced sideways movement, with several individuals expecting the price to fall below $2. However, this has not been the case as cardano replicated gains experienced by Bitcoin, this placed the bulls in control to push the price up, but this was met with strong resistance by the bears.
Trading volumes on the 21st of October signified an increase in sell-off by the bears to maintain the downward action. However, the 22nd October trading volume indicates a positive buying action, which could be the bulls attempting to come back.
As of the writing of this price analysis, the Cardano price stands at $2.18 per coin, which translates to a 24-hour price loss of 2.18%. Despite its pump, Cardano remains one of the underperforming assets as it has a seven-day price gain of just 2%.
Indicators
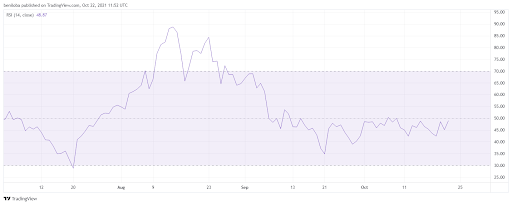
The relative strength index of Cardano reflects the state of the market across several weeks. As illustrated by the chart, the bulls slowly lost dominance since hitting all-time highs.
As of the 22nd of October, we see an RSI value of 48.8, therefore, still reflecting a bearish short term Outlook. We can also note the bearish action to occur as a response to attempts by the bulls to revive the ADA price.
A way to benefit from this market is to utilize the bearish strength as an opportunity to accumulate ADA tokens for the long term.
An RSI above the 50 value is needed to confirm a bullish scenario.
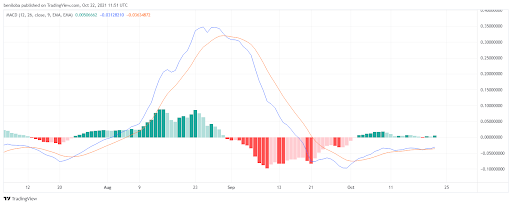
The macd trades beneath the zero line indicating a negative momentum in the market. The indicator also gives the average origin of the market; the histogram being nearly invisible indicates stability in the market. Considering the bearish momentum, this could mean that we might continue to see some more sideways or even bearish action from this token.
However, caution should be applied as the crypto market is known for creating parabolic price movements.
Dogecoin / US Dollar

As earlier stated, several altcoins experienced massive price pumps, Dogecoin being one that attempted to utilize its gains to break past previous levels of resistance. However, the 21st of October brought along a pushback by the bears leading to tanking Doge prices.
As of the writing of this price analysis, the Dogecoin price stands at $0.24 per coin, which corresponds to a loss of 2.9% in the last 24 hours; however, Dogecoin remains 6% up in the last seven days. With healthy attempts by the bulls and resistance by the bears, analysts remain optimistic about the Dogecoin hitting the $1 mark by the end of this Bullrun.
Indicators

The relative strength index illustrates a positive market with an accumulation of Dogecoin occurring, and the stop can see this in selling action experienced by Dogecoin. The current RSI value stands at 53, illustrating some stability after the bearish action.

The MACD line further buttresses the stability indicated by the RSI, which is also seen in the positive zone (above the zero line), and this means that despite the recent downward action, Dogecoin still maintains a reduced positive momentum in favour of the bulls.
Correlations
- Bitcoin / Ethereum = 0.83 (-0.27)
- Bitcoin / Ripple = 0.89 (0.23)
- Bitcoin / Litecoin = 0.89 (-0.88)
- Bitcoin / Bitcoin cash = 0.91 (-0.30)
- Bitcoin / Cardano = 0.84 (+0.09)
- Bitcoin / Dogecoin = 0.90 (-0.26)
With the recent market pump, several assets utilized the momentum to push Past former areas of resistance. However, a huge correction followed, temporarily setting back some assets.
Due to this minor correction, the Bitcoin dominance is down 0.58% to stand at 45.83%, while the total market volume is down 15.62% to stand at $110.96B in the last 24 hours.
Keynotes for today
- Bitcoins attains a new all-time high amidst bullish fundamentals, and an all-time high has a current price of $66,609.
- Ethereum follows Btc’s footsteps to break past previous resistance levels, and ETH currently trades at $4.146.
- Ripple’s court case stalls the progress of XRP; the current Xrp price stands at $1.10.
- Bitcoin cash bears holding on to previous resistance of $640, and the current Bitcoin cash price stands at $633.
- Litecoin large wick illustrates rejection from the $214 mark, LTC currently trading at $198 per coin.
- Cardano, still under bearish influence, currently trades at $2.18.
- Dogecoin is still to receive the price to kickstart a moon action, currently trading at $0.24.