Bitcoin / US Dollar

Following significant bearish action that saw the Bitcoin market fall below its 50-day moving average, the Bitcoin bulls have mounted a response to revive the market.
The 12th of April sees bullish momentum after flipping an initial bearish action, resulting in a 1.39% rise in the Bitcoin price, bringing its value to $40,086 per coin, with the highest and lowest BTC trading prices standing at $40,705 and $39,250 per coin.
At the start of the 13th of April, we see an early bullish action, resulting in a 0.17% increase in the Bitcoin price, translating to $40,155 per coin, with the highest and lowest trading prices seen standing at $40,275 and $39,550, respectively.
Indicators

The indicator chart shows that the Bitcoin market remains under bearish dominance as the relative strength index and the histogram and MACD are placed in bearish territory.
Due to the bullish activity on the 12th and 13th of April, the RSI increased to 38 and 38.34, respectively.
The MACD and histogram remain below the zero line, indicating bearish control of the market momentum and a negative outlook for the asset.
Buy and sell BTC on Remitano
Ethereum / US Dollar

On the 12th of April, the bulls started a momentum after flipping an initial bearish, maintaining the ETH market above its 50-day moving average of $2,957 and in bullish control. With the above, the bulls influenced a 1.62% rise in the ETH price, bringing the price of each coin to $3,027. On the 13th of April, the bulls continued their previous momentum, resulting in a 0.62% rise in the ETH price, translating to $3,046 per coin, with the highest and lowest price points being $3,070 and $3,005.
Indicators

The RSI remains below the 50 mark indicating bearish dominance of the market momentum.
On the 12th and 13th of April, the bullish activity in the market resulted in the relative strength index rising, standing at 44 and 45.
The MACD remains above the zero line, indicating bullish dominance of the market momentum. However, the histogram falls below the zero line due to recent bearish action, indicating bearish momentum.
Buy and sell ETH on Remitano
Ripple / US Dollar
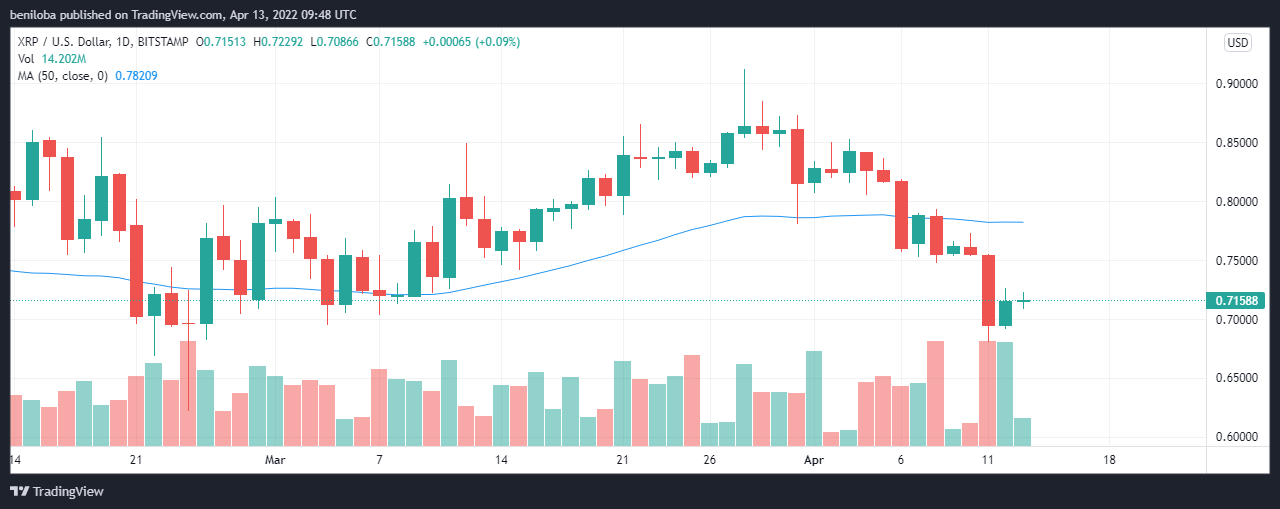
On the 12th of April, the bulls flipped an initial bearish market as indicated by the wick below the candle, and With the continued bullish dominance of the day, the XRP market rose by 2.92%, bringing the assets price to $0.715 per coin. On the 13th of April, a budding bullish action resulted in a 0.09% rise in the XRP price, translating to $0.715 per coin. The XRP market remains well below its 50-day moving average of $0.782. Nevertheless, the highest and lowest price points stand at $0.722 and $0.708.
Indicators
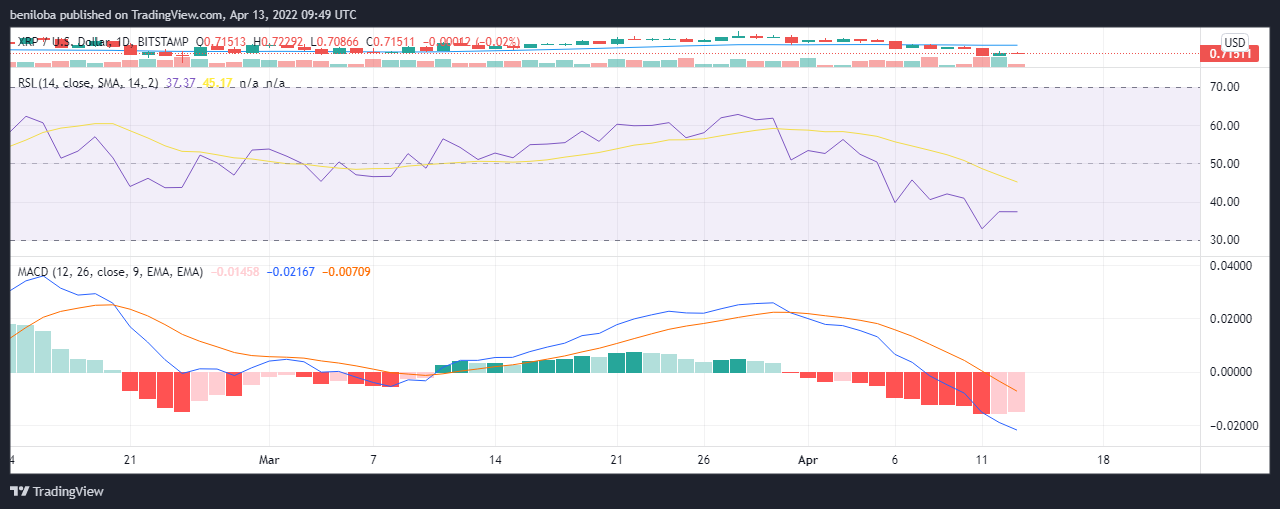
On the 12th of April, the bullish action resulted in a rise of the RSI to 37. With the continued bullish action on the 13th of April, the RSI has risen to 37.37. With the RSI below the 50 mark, the XRP market remains under bearish dominance.
The histogram and MACD remain in the bearish territory (below the zero line), indicating bearish dominance of the market.
[Buy and sell XRP on Remitano](https://remitano.com/xrp/
Litecoin / US Dollar
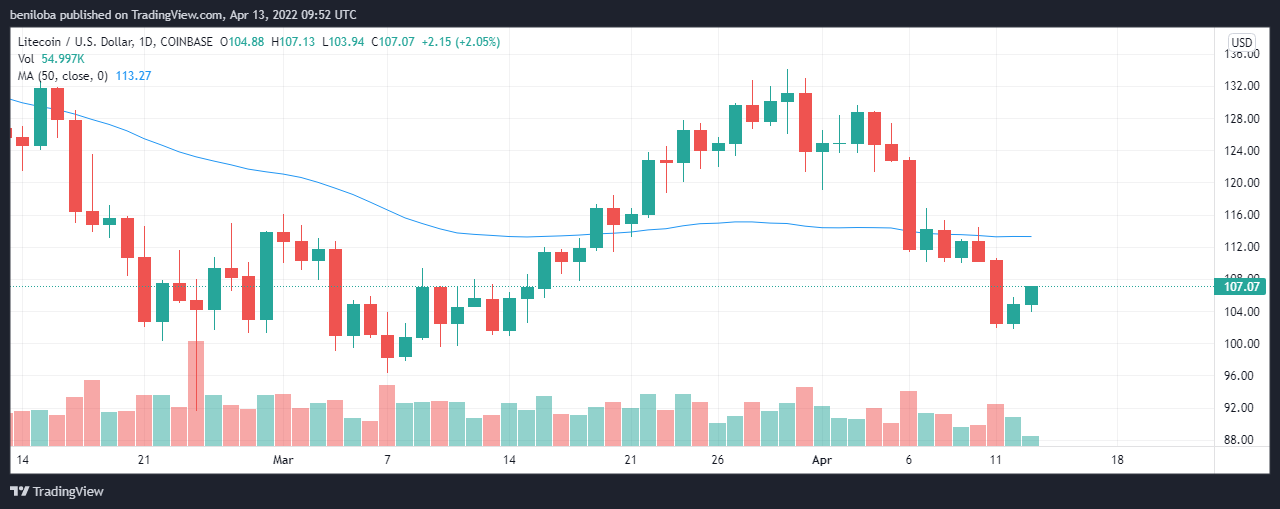
The bulls are seeing initiating momentum to get the Litecoin market back above its 50-day moving average of $113 per coin.
On the 12th of April, the bullish action saw the Litecoin market rise by 2.32% after flipping an initial bearish start to the day, translating to $104 per coin. On the 13th of April, the Litecoin market saw more bullish activity, placing the market 2.05% higher, translating to $107 per coin, with the highest and lowest price points at $107 and $103, respectively.
Indicators
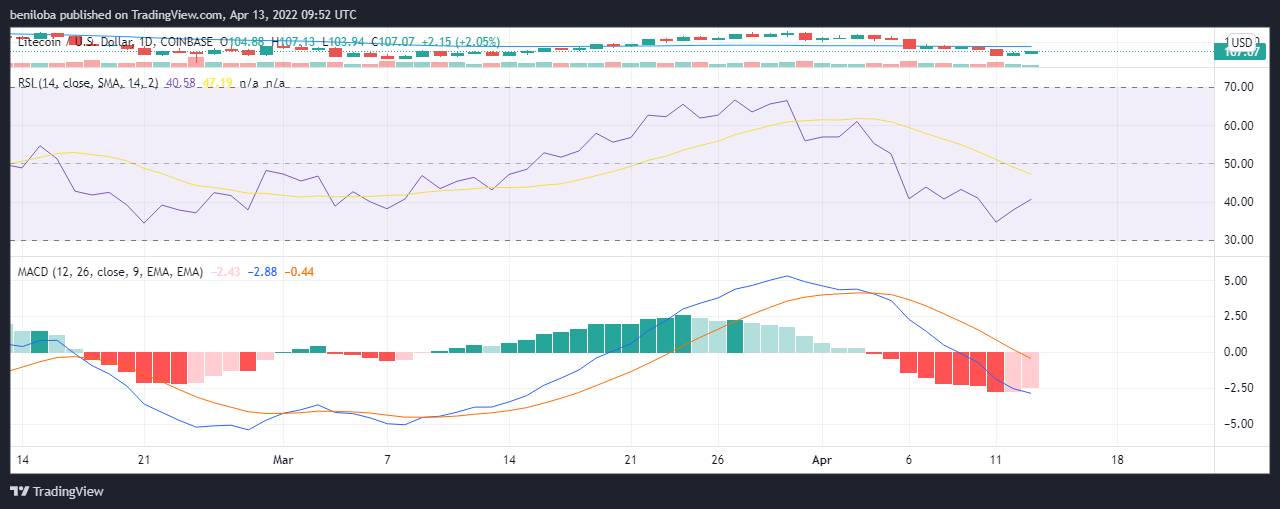
The relative strength index has fallen below the 50 mark, indicating the dominance of the bears over the market.
On the 12th and 13th of April, sustained bullish action resulted in a rise of the RSI to 37.80 and 44, respectively.
The histogram and MACD remain below the zero line, creating a negative outlook for the market.
Buy and Sell LTC on Remitano
Bitcoin Cash / US Dollar

On the 12th of April, the bulls initiated a momentum that saw the Bitcoin Cash market rise by 3.41%, bringing the asset's price to $304 per coin. The wick above the candle indicates a bearish attempt to reduce the day's gains. On the 13th of April, the bulls continue their previous momentum, resulting in a 0.85% rise in the market, placing the Bitcoin Cash price at $307 per coin. The wick above and below the candle denote the highest and lowest price points seen, corresponding to $308 and $301.
The Bitcoin Cash market remains below its 50-day moving average of $326, reflecting bearish market control.
Indicators
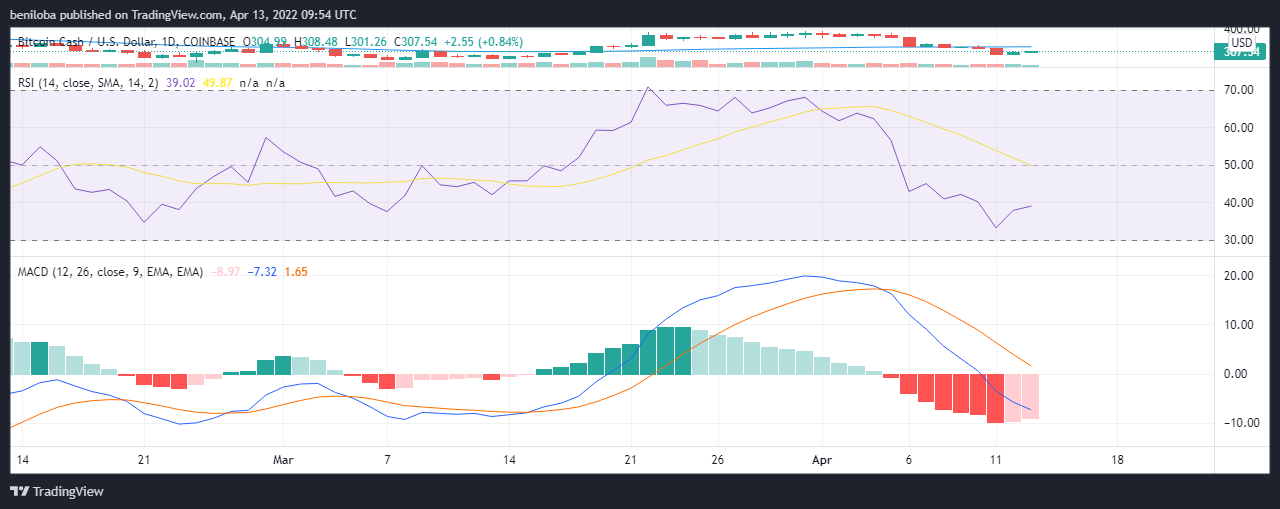
The bullish action on the 12th and 13th of April resulted in a rise of the relative strength index to 37.81 and 39.02. With the RSI below 50, the market remains bearish.
The MACD and histogram portray a market in a bearish grasp as it stands below the zero line, creating a negative outlook for the market.
Buy and sell BCH on Remitano
Cardano / US Dollar

On the 12th of April, the bulls started a momentum, resulting in a 3.77% rise in the market, bringing the ADA price to $0.954 per coin. On the 13th of April, we see the bears attempting to start a momentum resulting in the ADA price dropping by 0.21%, bringing its price to $0.952 per coin. With the market still far from its close, the above value is likely to change. Nevertheless, as of the writing of this piece, the highest and lowest ADA prices stand at $0.962 and $0.942, respectively.
Indicators
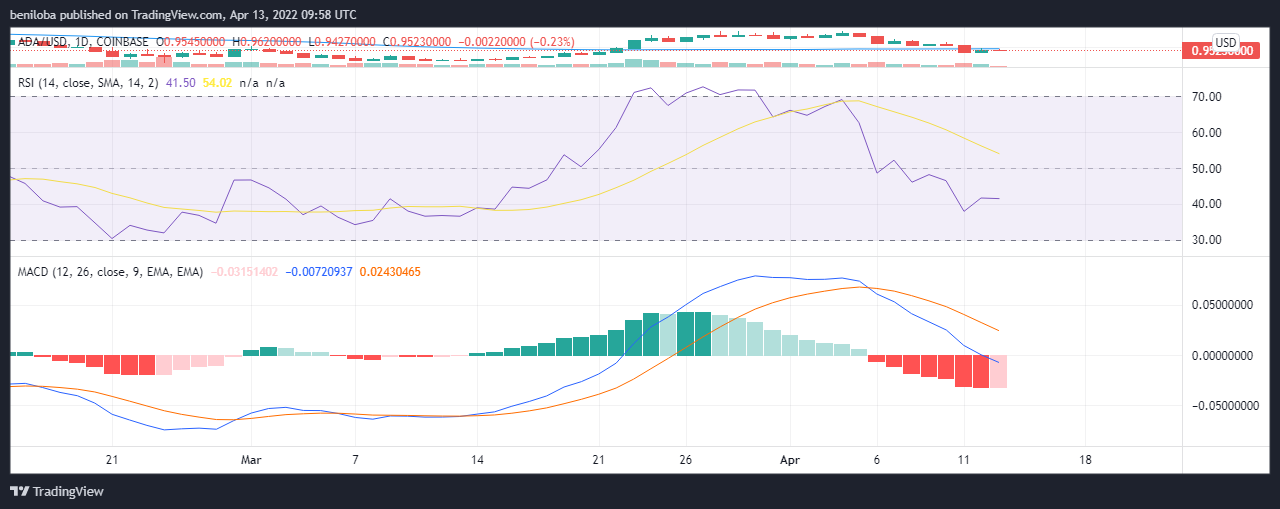
On the 12th of April, bullish price action sees the relative strength index rise though maintaining a level below the 50 mark, corresponding to 41.67. On the 13th of April, the bearish action resulted in a fall of the relative strength index to 41.50.
The MACD and Histogram show a bearish shift, indicating growing bearish activity in the market.
Swap to ADA
Dogecoin / US Dollar

The bulls initiated a momentum on the 12th of April, resulting in a 2.91% rise in the Dogecoin price, translating to $0.138 per coin. The highest and lowest Dogecoin trading prices for the day stood at $0.144 and $0.133, respectively.
At the start of the 13th of April, we see continued bullish action, resulting in a 1.30% rise in the Dogecoin price, bringing its price to $0.139 per coin, with the highest and lowest trading prices standing at $0.143 and $0.139, respectively.
Indicators
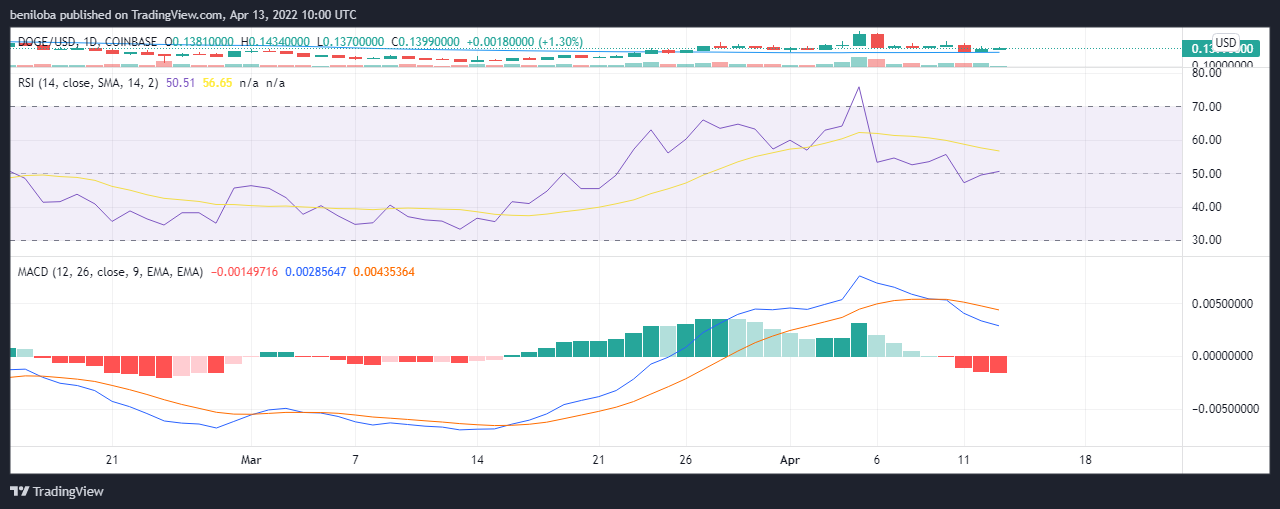
On the 12th and 13th of April, the RSI stands at 49.43 and 50.51, depicting a slight increase in the market out of immediate bearish control of the momentum.
The MACD stands well above the zero line, indicating bullish dominance. However, we see the histogram in the bearish territory due to sustained bearish action while the MACD maintains its course downwards to the zero line.
Swap to DOGE
Correlations
- Bitcoin / Ethereum = 0.92
- Bitcoin / Ripple = 0.71
- Bitcoin / Litecoin = 0.79
- Bitcoin / Bitcoin cash = 0.57
- Bitcoin / Cardano = 0.85
- Bitcoin / Dogecoin = 0.69
Keynotes for today
- Bitcoin at $40,155 per coin.
- Ethereum at $3,046 per coin.
- Ripple at $0.715 per coin.
- Litecoin at $107 per coin.
- Bitcoin Cash at $307 per coin.
- Cardano at $0.952 per coin.
- Dogecoin at $0.139 per coin.





