On the 12th of February, the bears flipped an initial bullish momentum as indicated by the wick above the candle, which denotes the highest trading price of Bitcoin of the day at $43,050 per coin. With the heavily contested bearish start to the market, the bears influenced a 0.33% drop in the Bitcoin price, bringing the price of each coin to $42,244. The chart also illustrates the bullish rejection of further bearish action. They attempted to minimize the losses seen on the day, indicated by the wick below the candle and placing the lowest price of Bitcoin for the day at $41,750 per coin.
At the start of the 13th of February, we see the bears continuing their previous momentum. From the above chart, we see increased selling volumes, resulting in a bearish dominance of the market at its start with a little bullish resistance; with the bearish move for the day, the Bitcoin price is down by 0.40%, bringing its price to $42,074. With this move, the bears lead the market, but we could see a shift in the market momentum with so much time left. Nevertheless, as at the writing of this piece, the highest and lowest Bitcoin trading price for the day stands at $42,781 and $41,885, respectively.
On the 14th of February, the bulls have an early start to the market in an attempt to recover the losses seen over the previous days by flipping an initial bearish momentum as indicated by the wick below the candle, which denotes the lowest trading price of Bitcoin of the day at $41,570 per coin. With the contested bullish start to the market, the bulls have influenced a 0.39% increase in the Bitcoin price, bringing the price of each coin to $42,240.
The chart also illustrates the bullish rejection of further bearish action as indicated by the wick below the candle. The bears are seen resisting the bullish move as indicated by the wick above the candle in an attempt to minimize the gains seen on the day, placing the highest price of Bitcoin for the day at $42,438 per coin.
Over the last three days, it is evident that the Bitcoin bears are aiming to gain control of the market, which can be achieved by bringing the market below its 50-day moving average of $42,438 and sustaining the market below this level. However, the bullish pushback on the 14th signifies the bull's attempt to maintain market control.
Indicators

Despite the bearish action over the last few days, the Bitcoin market remains bullish, as indicated by the relative strength index above the 50 mark. On the 12th of February, the bearish action resulted in a fall of the RSI to 53.96. With the sustained but contested bearish start to the 13th of February, we see the relative strength index fall to 53.16, reflecting the bears struggling to gain control of the market. With the bullish start to the 14th of February, the positive momentum seen has increased the RSI to 53.84.
The histogram remains bullish; however, we see reduced bullish activity on February 12th, 13th, and 14th. In correlation with other indicators, the MACD places slightly above the zero line, indicating a positive outcome for the asset.
Buy and sell BTC on Remitano
Ethereum / US Dollar
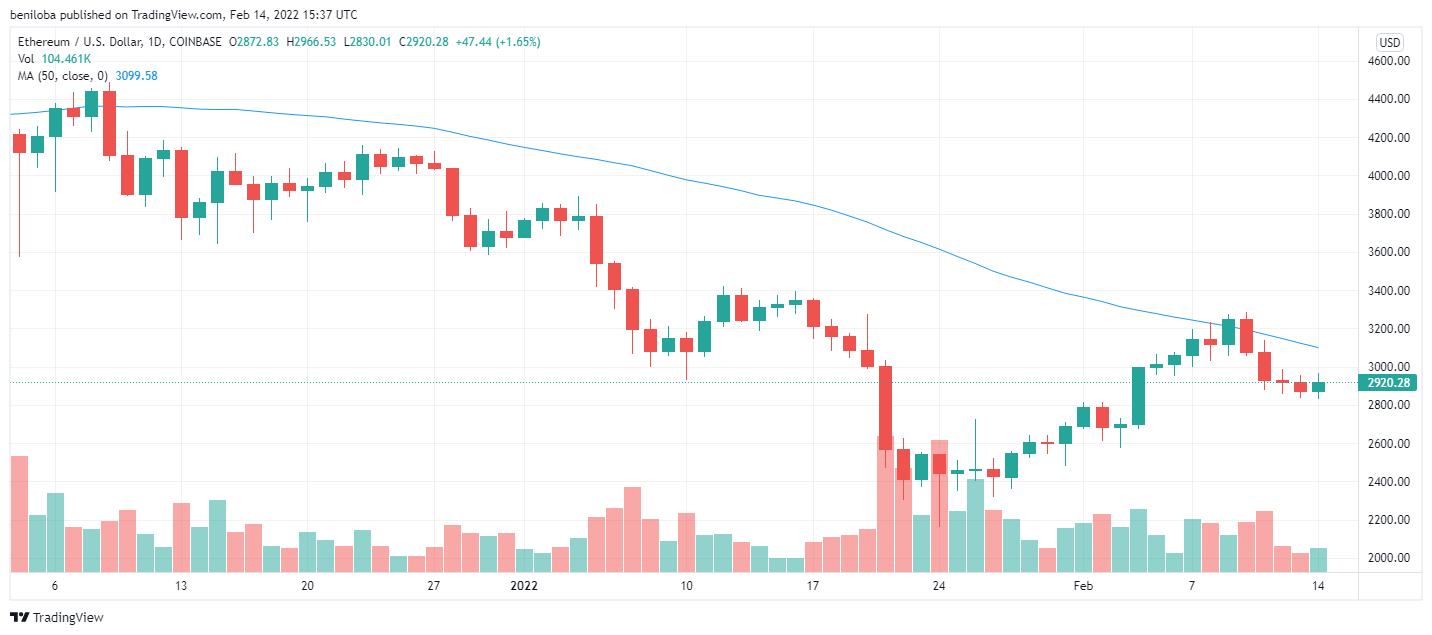
The above chart shows that the Ethereum market remains below its 50-day moving average of $3,099 per coin; however, the chart also shows consecutive bearish action over the last few days, pulling the ETH price well below its moving average, maintaining the asset in a downtrend.
On the 12th of February, the bears gained control of a heavily contested market after successfully flipping an initial bullish momentum as indicated by the wick above the candle, which denotes the highest trading price of ETH for the day at $2,987 per coin. With the heavily contested bearish start to the market, the bears influenced a 0.31% drop in the ETH price, bringing the price of each coin to $2,919. The chart also illustrates the bullish rejection of further bearish action. They attempted to minimize the losses seen on the day, indicated by the wick below the candle and placing the lowest price of Bitcoin for the day at $2,857 per coin.
At the start of the 13th of February, we see the bears continuing their previous momentum. We see increased selling volumes from the above chart, resulting in a bearish dominance of the market at its start with a little bullish resistance; with the bearish move for the day, the Ethereum price is down by 1.61%, bringing its price to $2,872. Nevertheless, the highest and lowest Bitcoin trading price for the day stands at $2,955 and $2,836, respectively.
On the 14th of February, the bulls have an early start to the market in an attempt to recover the losses seen over the previous days by flipping an initial bearish momentum as indicated by the wick below the candle, which denotes the lowest trading price of Bitcoin of the day at $2,830 per coin. With the bullish start to the market, the bulls have influenced a 1.65% increase in the Ethereum price, bringing the price of each coin to $2,920. The chart also illustrates the bullish rejection of further bearish action as indicated by the wick below the candle. The bears are seen resisting the bullish move as indicated by the wick above the candle in an attempt to minimize the gains seen on the day, placing the highest price of Ethereum for the day at $2,966 per coin.
Over the last three days, it is evident that the bears are aiming to gain control of the market, which can be achieved by bringing the market below its 50-day moving average of $3,099 and sustaining the market below this level. However, the bullish pushback on the 14th signifies the bull's attempt to maintain market control.
Indicators
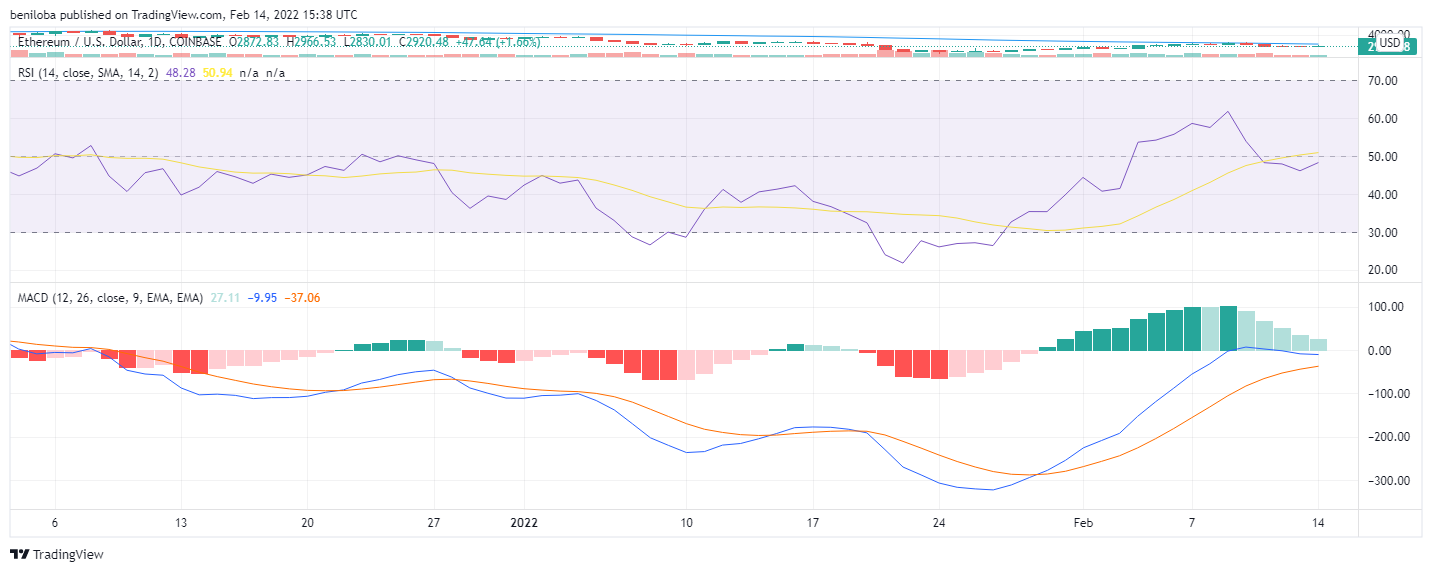
Over the last few days, the bearish action has succeeded in bringing the ETH market into bearish territory as its relative strength index trades below the 50 mark. On the 12th of February, the bearish action resulted in a fall of the RSI to 47.97. With the sustained but bearish start to the 13th of February, we see the relative strength index fall to 46.17, reflecting the bears struggling to gain control of the market. With the bullish start to the 14th of February, the positive momentum seen has increased the RSI to 48.28.
The histogram remains bullish though of reduced intensity. The MACD places slightly below the zero line in correlation with other indicators, indicating a bearish outcome for the asset.
Buy and sell ETH on Remitano
Ripple / US Dollar

From the above chart, we see the Ripple market remains above its 50-day moving average of $0.740 despite the bearish action seen in the market, indicating a slight bullish dominance in the market.
On the 12th of February, the bulls initiated a massive bullish move as a response to the bearish action of the previous day, resulting in an 8.28% growth in the Ripple price, translating to $0.822 per coin. The bears provided resistance to the further price growth as indicated by the wick above the candle, which also denotes the highest Ripple trading price for the day at $0.853 per coin, while the lowest trading price of Ripple for the day stood at $0.746 per coin.
At the start of the 13th of February, the bears gained a headstart to dominate the market as a response to the previous bullish momentum, resulting in a 2.06% drop in the Ripple price, translating to $0.805 per coin with the highest and lowest trading prices achieved stand at $0.847 and $0.790, respectively.
At the start of the 14th of February, we see the bears continue their momentum of the previous day, intending to bring the market below its 50-day moving average. The Ripple market is down by 0.11%, translating to $0.804 per coin with this move. However, with the market still in its early hours, we could see more volatility. Nevertheless, as at the writing of this analysis, the highest and lowest price points achieved stand at $0.812 and $0.777, respectively.
Indicators

Due to the heavy price action over the last few days, the relative strength index still bullish shows a decline. The current momentum remains in firm control of the bulls, and the relative strength index on the 12th, 13th, and 14th of February stands at 60, 58.20, and 58.01, respectively. Consecutively showing reducing bullish activity, reflecting the increasing bearish action in the market.
In correlation to the RSI, the MACD and histogram illustrate growing bullish entry into the market. The MACD makes an ascent to the zero line, which creates a positive outlook for the asset.
Buy and sell XRP on Remitano
Litecoin / US Dollar
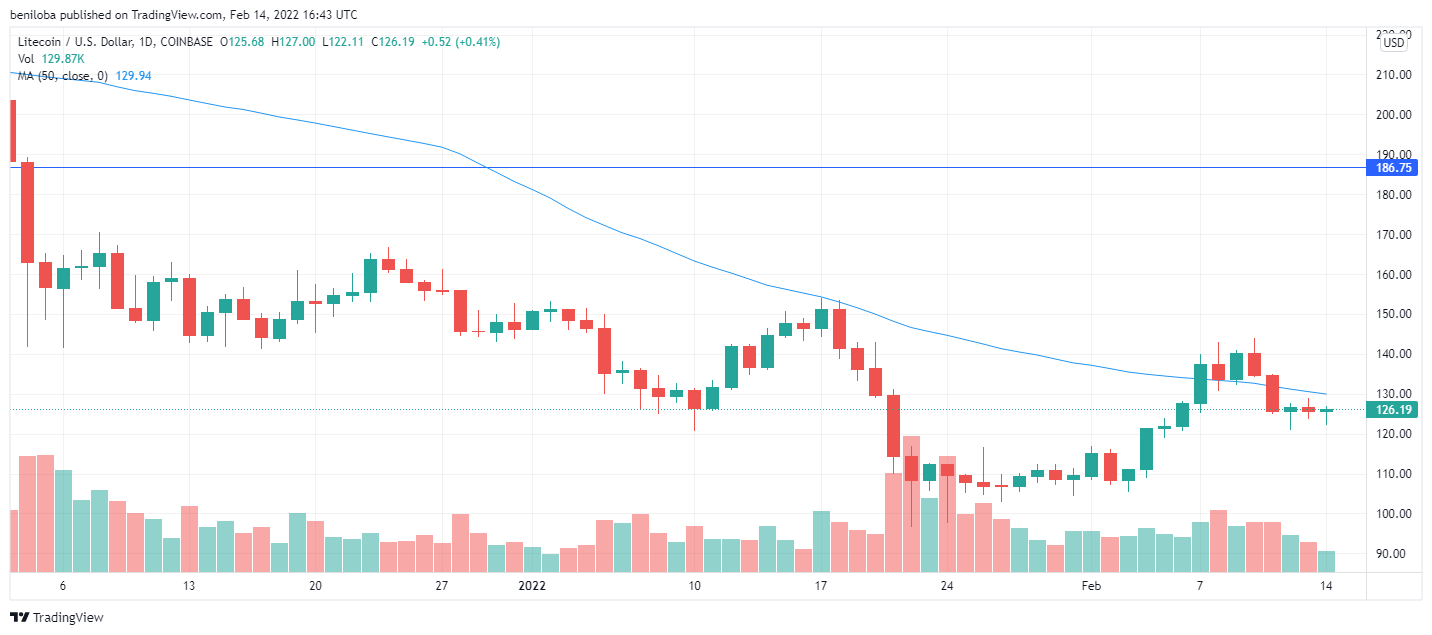
The above chart shows that the Litecoin market is steady in bearish control as it remains below its 50-day moving average of $129 per coin.
On the 12th of February, the gains seen in the Litecoin market were significantly contested by the bears, resulting in a minute gain of 0.87%, bringing the LTC price to $126 per coin. With the continued struggle for market dominance, we see the highest and lowest price points achieved for the day at $127 and $120, respectively.
On the 13th of February, the bulls established an initial move in the market; however, bearish resistance sees the bulls lose control of the market in favor of the bears who influenced a 0.88% drop, bringing the LTC price to $125 per coin. At the start, of the 14th of February, we see the bulls attempting to restart their momentum after flipping an initial bearish start to the market and influencing a 0.41% growth in the LTC price, translating to $126 per coin, while the highest and lowest price points seen in the market stand at $127 and $122, respectively. With much time left to the close of the market for the day, these values are subject to change due to volatility.
Indicators

The relative strength index indicates a market in bullish control with its value slightly above the 50 mark. On February 12th, 13th, and 14th, the relative strength index shows a balance between the bullish and bearish activity in the market, corresponding to 50.57, 49.69, and 50.07, indicating increasing bullish activity.
In correlation to the RSI, we see reduced bullish activity in the MACD and histogram, reflecting the equilibrium in the market and, with these indicators above the zero line, a bullish outlook for the asset.
Buy and Sell LTC on Remitano
Bitcoin Cash / US Dollar
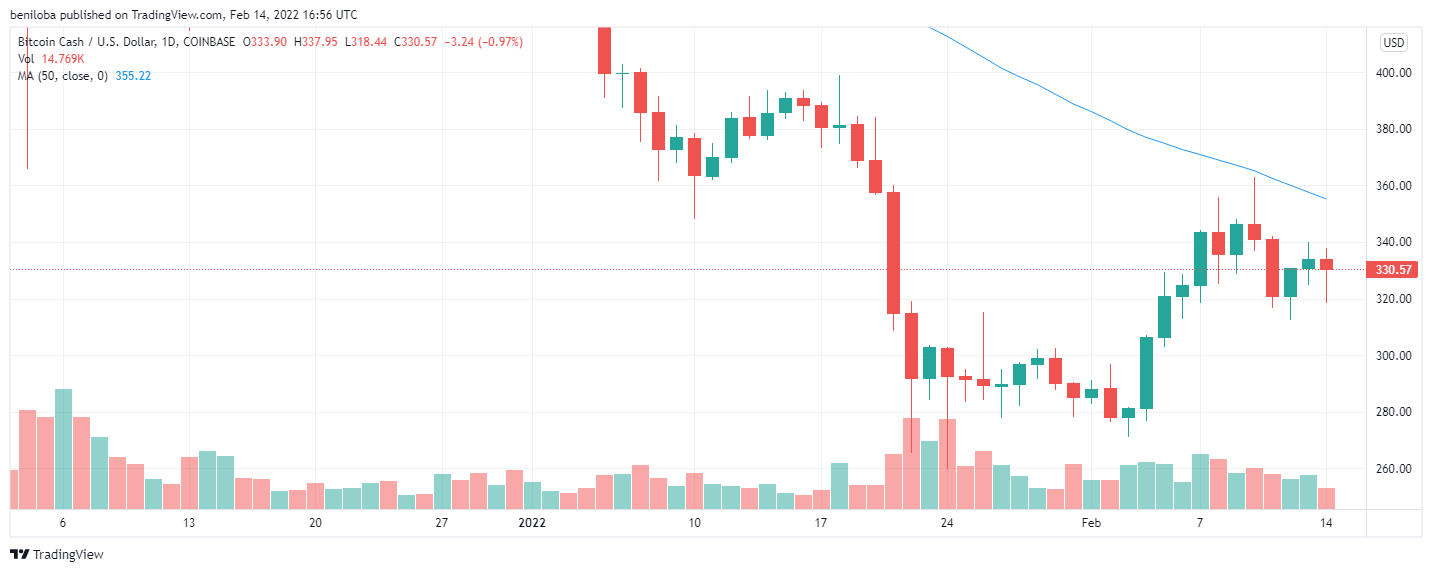
The Bitcoin Cash bulls are seen pushing the BCH market towards its 50-day moving average of $355 per coin on the 12th of February, as indicated by the bulls momentum following flipping of an initial bearish start to the market, resulting in a 3.60% increment in the Bitcoin Cash price, translating to $330 per coin, with the highest trading price of $330 per coin, while the lowest trading price for the day as indicated by the wick below the candle stands at $312 per coin.
After toppling an early bearish move on the 13th of February, the bulls went on to influence a 0.96% growth in the Bitcoin Cash price, translating to $333 per coin, with the highest and lowest price points seen in the market at $340 and $324, respectively, a higher low.
At the start of the market on the 14th of February, the bears have an early start after toppling an initial bullish action as indicated by the wick above the candle, influencing a 0.97% decrease in the Bitcoin Cash price as at writing this piece, translating to $330 per coin. With the market yet to close for the day, we likely will see more volatility; however, Bitcoin Cash's highest and lowest trading prices stand at $337 and $318, respectively.
Indicators

The Bitcoin Cash market remains slightly bullish as its relative strength index over the last few days remains at the 50 mark. We see the relative strength index on the 12th, 13th, and 14th of February stand at 50.09, 51.24, and 50. The bullish outlook for the asset is correlated by the histogram and MACD, with the MACD slightly below the zero line, slowing down due to bearish action seen on the 14th.
Buy and sell BCH on Remitano
Cardano / US Dollar

On the 12th of February, the bears continued their momentum over the last few days, resulting in a drop of 1.92%, bringing the ADA price to $1.059 per coin, while the highest and lowest price points achieved stood at $1.093 and $1.030, respectively.
Following their momentum, the bears continued on the 12th, resulting in a drop of 1.56%, bringing the ADA price to $1.043 per coin, while the highest and lowest price points achieved stood at $1.077 and $1.032, respectively.
We see the bulls attempting to revive the ADA market on the 14th of February, resulting in a 0.93% growth as this piece's writing, bringing the ADA price to $1.052 per coin. With the market still far from its close, we will likely see more volatility.
Nevertheless, the current highest and lowest price points seen in the market stand at $1.055 and $1.018, respectively.
With the bearish action over the last few days, the ADA market falls farther away from its 50-day moving average, portraying a bearish outlook.
Indicators

With the bearish action over the last few days, we see the ADA relative strength index below the 50 mark, indicating a growing bearish effect on the market. With the above, the RSI on the 12th, 13th, and 14th of February stands at 42, 41, and 42.
In correlation to the RSI, we see the MACD deflect away from the zero line, which places the bears as the dominant force in the market.
Swap to ADA
Dogecoin / US Dollar

On the 12th of February, the bears attempted to continue their momentum seen over the last few days; however, bullish resistance to further price drop restricted the losses seen on this day to 0.21%, bringing the Dogecoin price to $0.144 per coin, while the highest and lowest price points achieved stood at $0.147 and $0.040, respectively.
On the 13th, the initiated a massive momentum, resulting in a rise of 2.56%, bringing the Dogecoin price to $0.148 per coin, while the highest and lowest price points achieved stood at $0.158 and $0.143, respectively.
We see the bears restarting their momentum on the 14th of February, resulting in a 1.15% drop as this piece's writing, bringing the Dogecoin price to $0.146 per coin. With the market still far from its close, we will likely see more volatility.
Nevertheless, the current highest and lowest price points seen in the market stand at $0.150 and $0.142, respectively.
With the bearish action over the last few days, the Dogecoin market falls farther away from its 50-day moving average, above which portrays a bearish outlook for the market.
Indicators
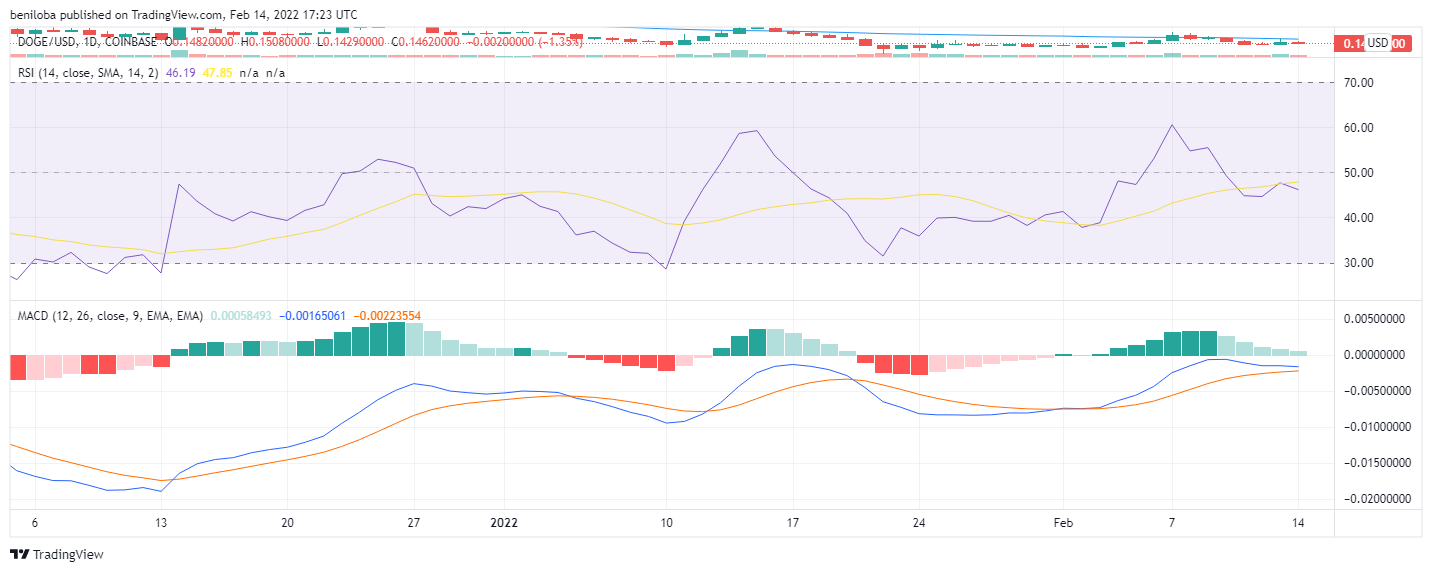
With the bearish action over the last few days, we see the Doge relative strength index stands below the 50 mark, indicating a growing bearish effect on the market. With the above, the RSI on the 12th, 13th, and 14th of February stands at 44, 47, and 45.
In correlation to the RSI, we see the MACD deflect away from the zero line, which places the bears as the dominant force in the market.
Swap to DOGE
Correlations
- Bitcoin / Ethereum = 0.90
- Bitcoin / Ripple = 0.88
- Bitcoin / Litecoin = 0.89
- Bitcoin / Bitcoin cash = 0.80
- Bitcoin / Cardano = 0.87
- Bitcoin / Dogecoin = 0.62
Keynotes for today
- Bitcoin at $42,240 per coin.
- Ethereum at $2,920 per coin.
- Ripple at $0.804 per coin.
- Litecoin at $126 per coin.
- Bitcoin Cash at $330 per coin.
- Cardano at $1.052 per coin.
- Dogecoin at $0.146 per coin.