Bitcoin / US Dollar
Price Analysis
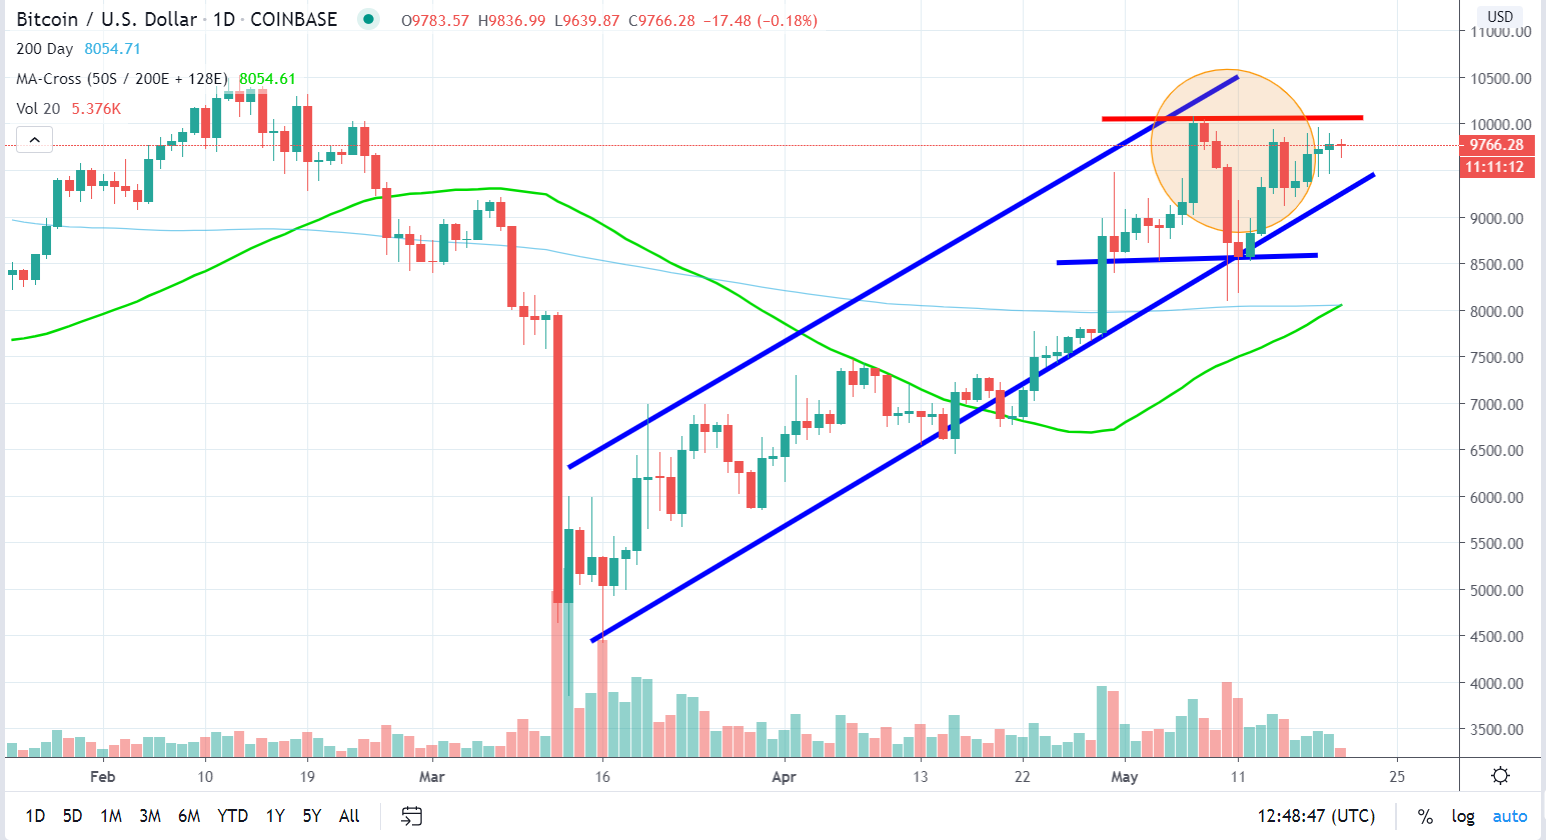
A calm period is often followed by a heavy change. The price continues to continue between the ascending parallel channels, without breaking the $ 10,000, the most crucial point for gaining momentum for an uptrend. The two higher highs at $ 10,000 and $ 9,750 showed that a bearish move could follow, describing Bitcoin's weakness to raise volumes and gain uptrend momentum.
The volume is rather low in the previous days, showing no clear direction towards a price movement. In parallel, the "Golden Cross" signal just appeared in the chart, showing a bullish signal for the future. It is safe to know that the previous "Crosses" signals have the opposite effect. The "Golden Cross" signal should be accompanied by the respective volume and resistance breaking in order to become effective and create new momentum for Bitcoin's price.
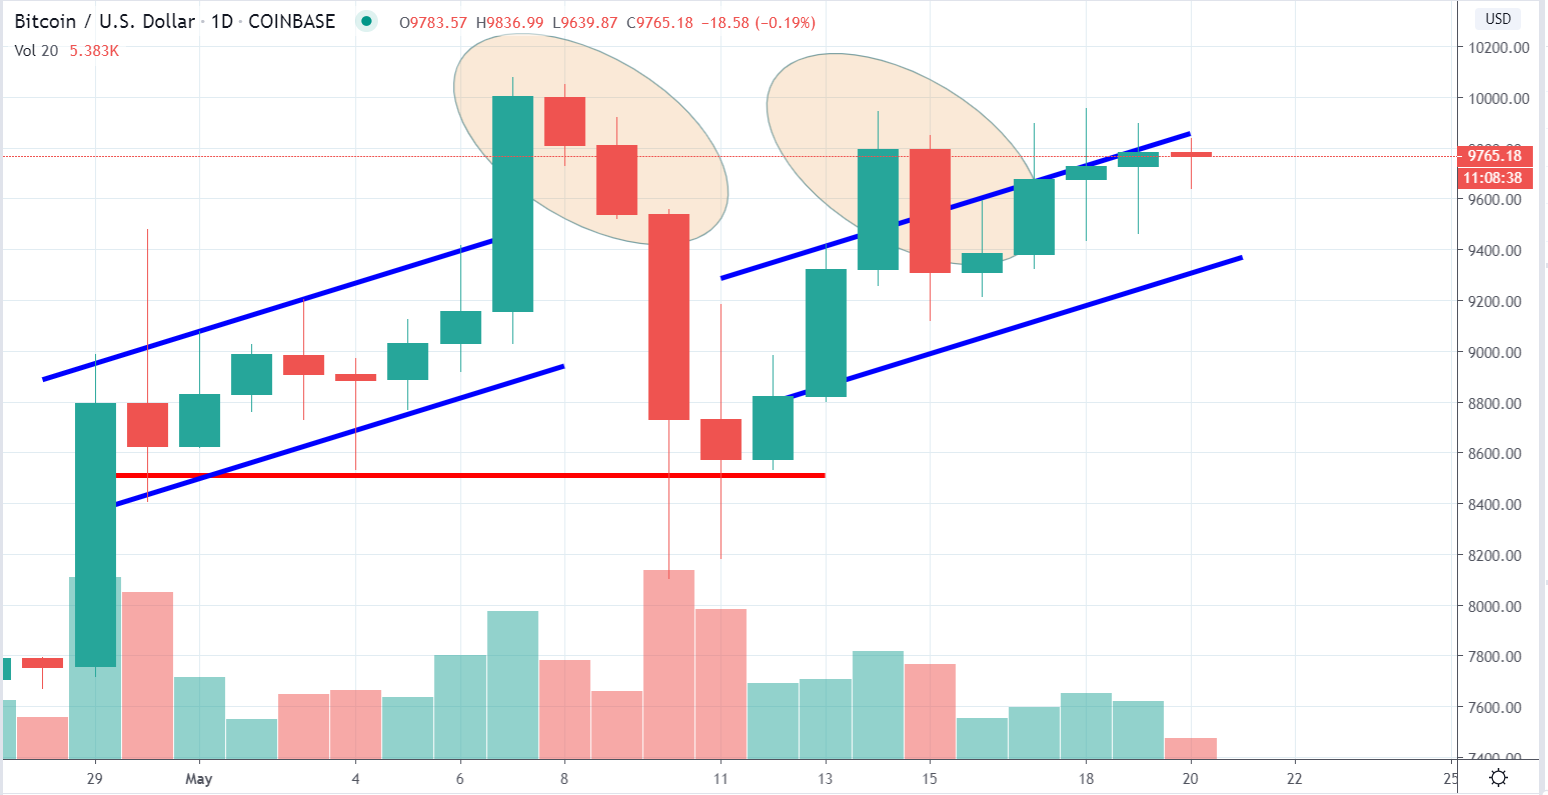
In the short-term diagram, we observe a third high to be formed as a triangle during the last week. The price continues to move between the ascending channels, showing little differences between the days. The slow and steady growth could work from a long-term perspective but it can't create profits for day traders. What we expect is the next days is a sharp move that will break the $ 10,000 resistance or a downward move, revealing Bitcoin's weakness to establish a new positive trend.
Indicators
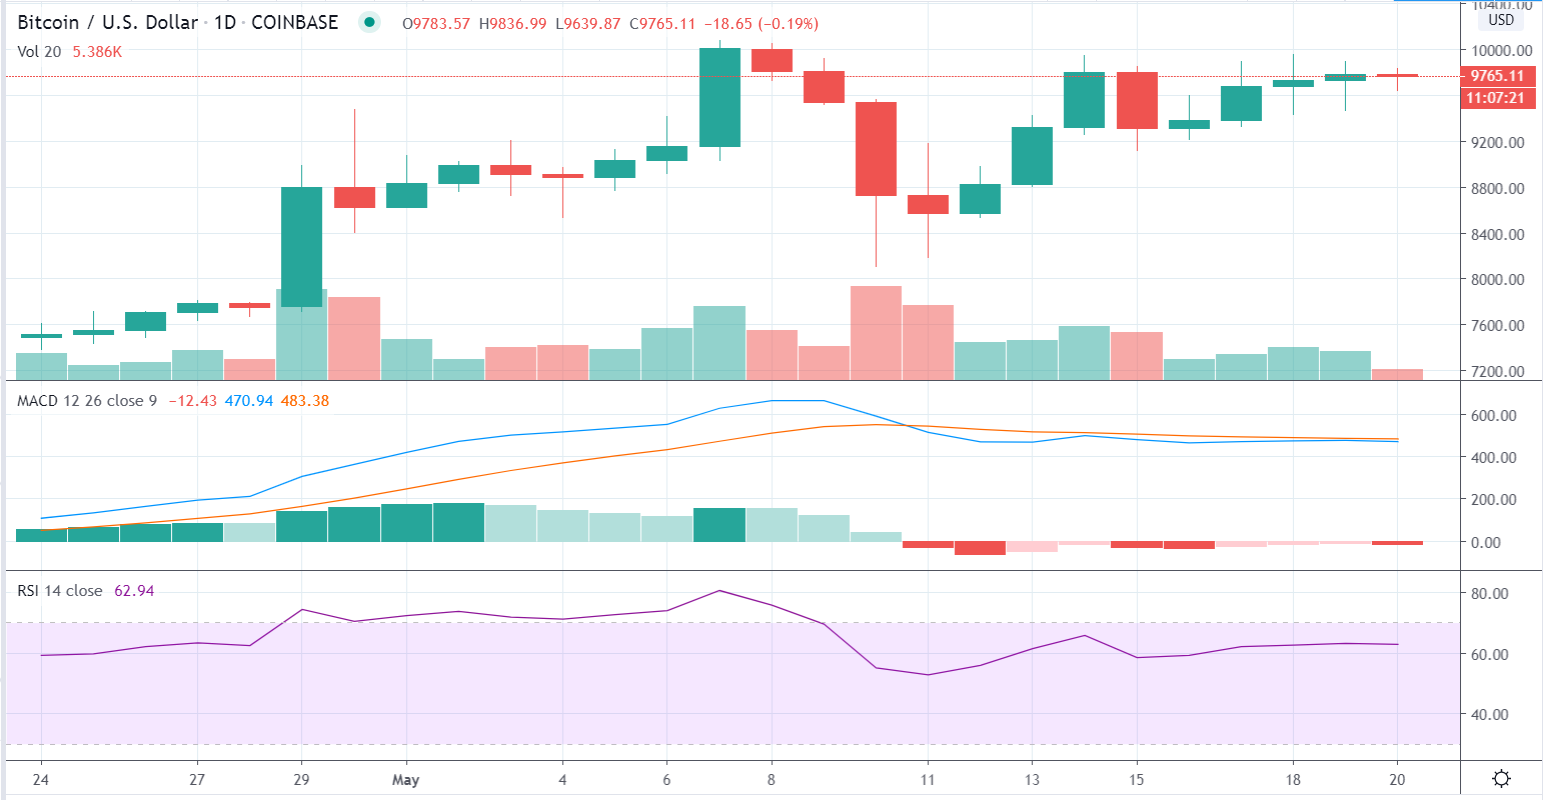
MACD index is again on the slightly negative zone, showing that there is stability in the foreseeable future, without any surprising moves. In parallel, the RSI index is above 60, getting closer to the overbought area and creating bearish signals for the next periods. The combination of all the above shows us that something big is coming for Bitcoin.
Ethereum / US Dollar
Price Analysis
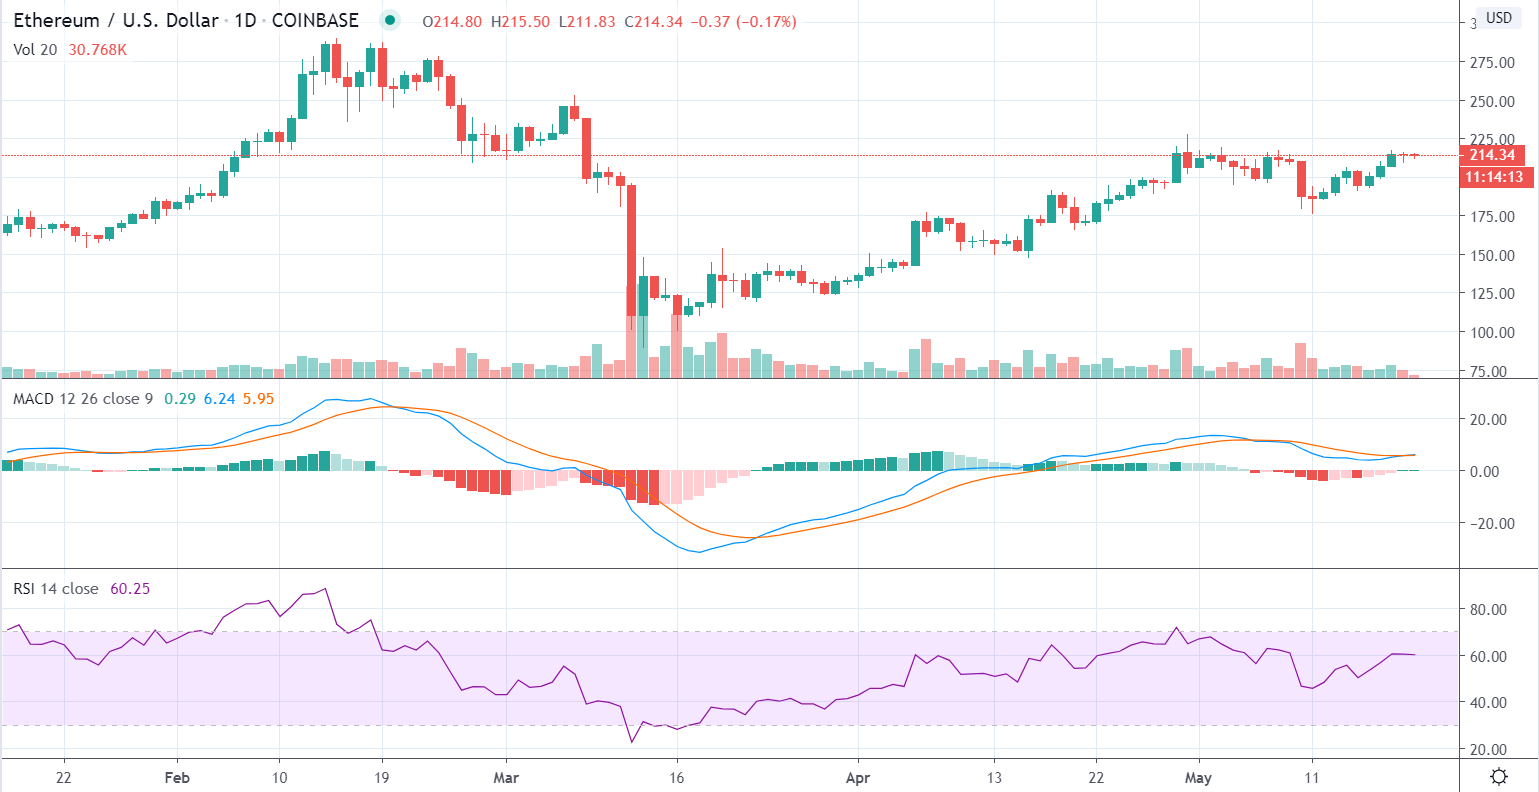
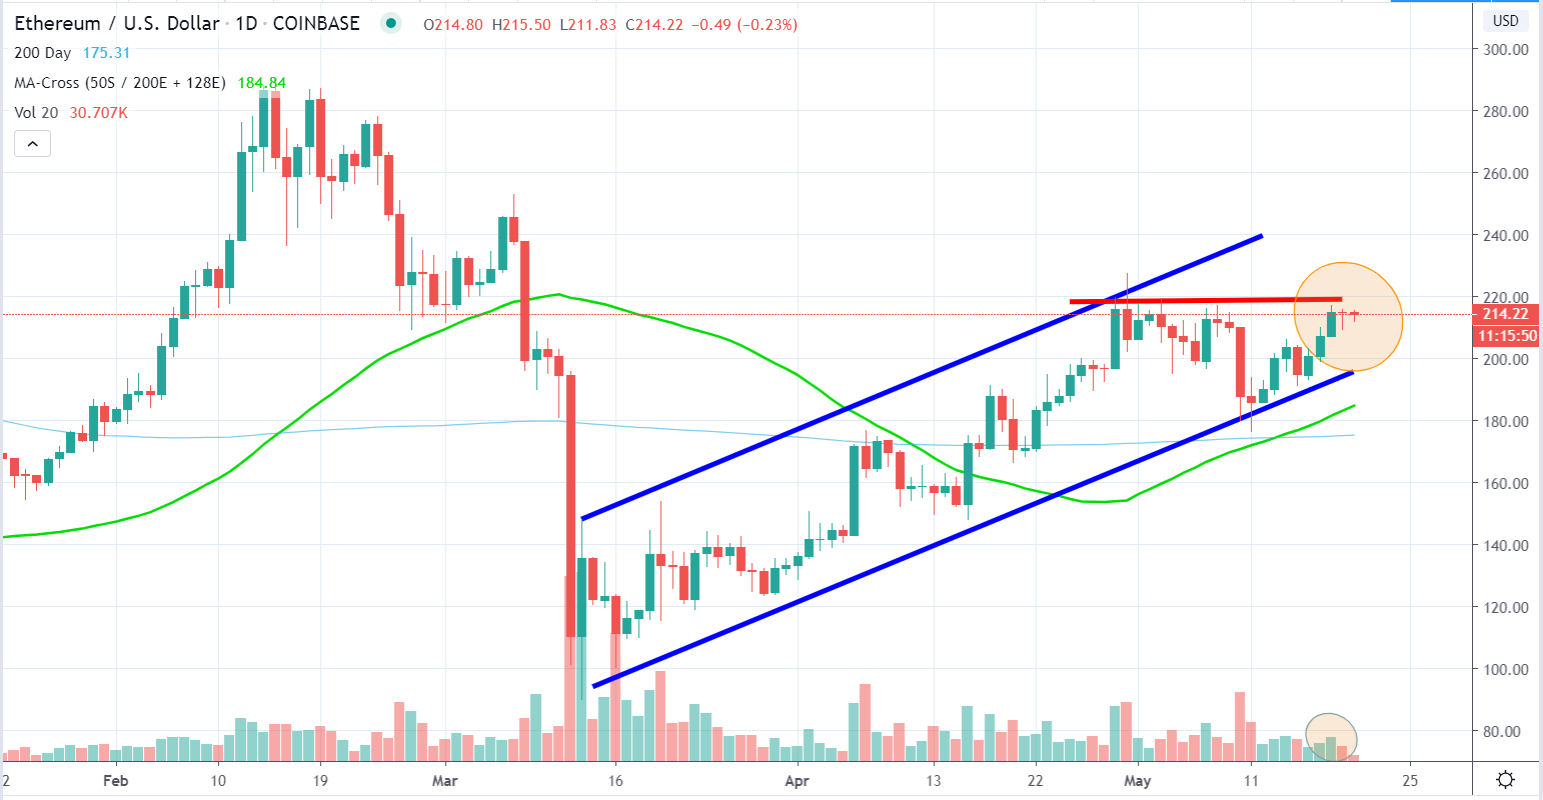
The same steady has been reached for Ethereum. The price is climbing slow and steady, between the ascending parallel channels, trying to break the $ 220 resistance. The "Golden Cross" signal appeared five days ago, giving some profits to day traders.
The continuity of the positive trend should continue with the proper volume. At the current moment, the volume is shrinking, showing that there is no "fuel" for establishing a viable trend and breaking the $ 220 resistance. The stationarity of Ethereum's price could be explained in the fundamentals as there are announcements about Ethereum 2.0, following the recent hard fork named "Constantinople".
The correlation between Bitcoin and Ethereum will also play an important role in the next periods as the cryptocurrency market is consolidating, creating opportunities for major coins.
Indicators
Regarding the indicators, the MACD index is near zero, showing no clear path for the next days. In parallel, the RSI index is hitting the 60 area, moving a step closer to the overbought area. We should also highlight that the correlations between MACD and RSI indexes for Bitcoin and Ethereum are much higher than the corresponding for the prices.