
Bitcoin / US Dollar
Price Analysis

Bitcoin / US Dollar
Price Analysis
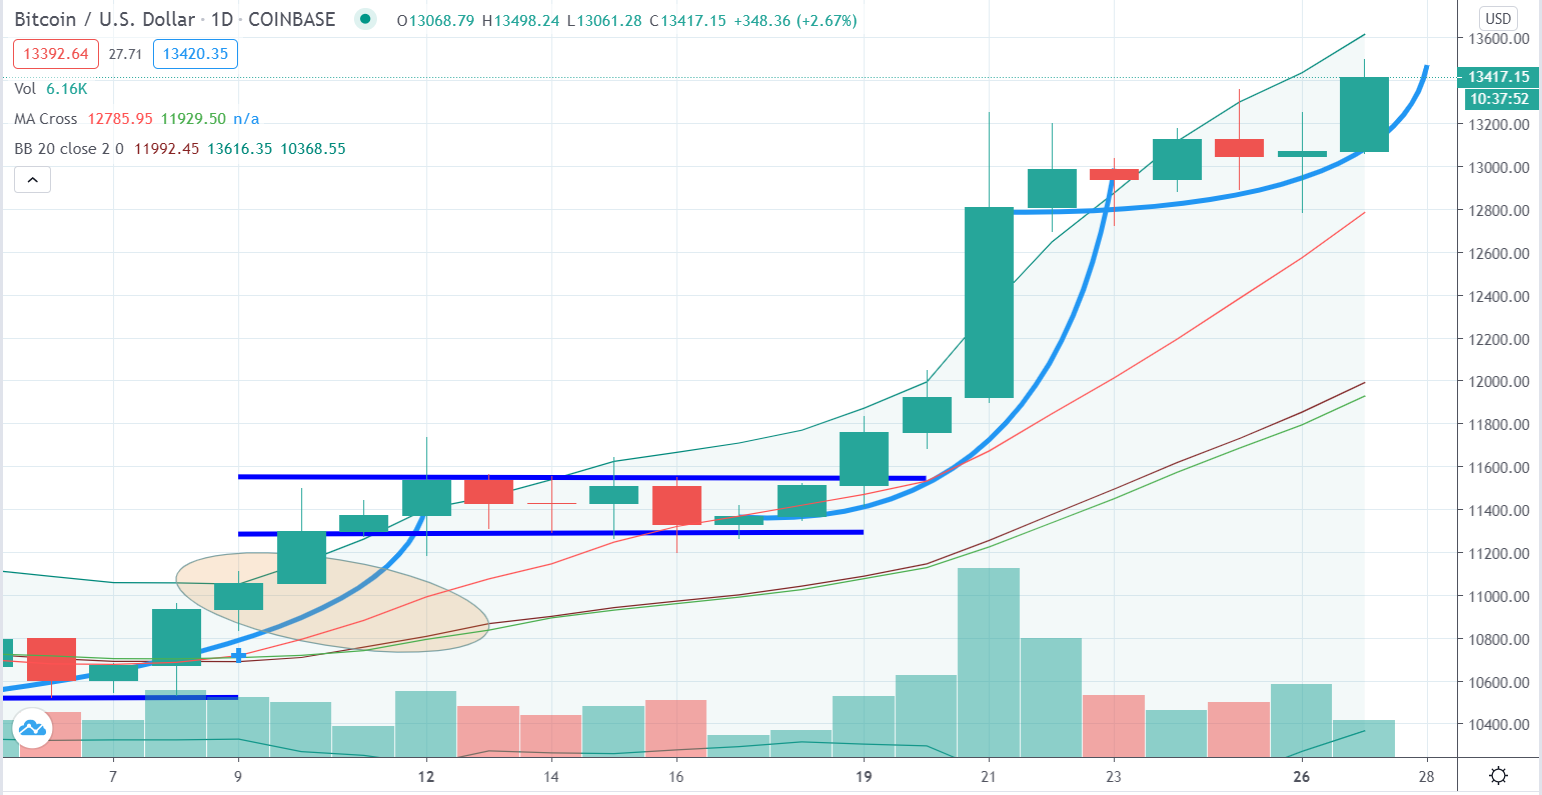
Bitcoin's price made another jump today, reaching $13,400. This high was not evident in the Bitcoin market for almost 3 years, making it possible to see another bullish market that could reach the all-time high level for Bitcoin, around $19,400. Of course, there is a lot to be done until now and most importantly, Bitcoin and crypto markets have changed a lot during the last 3 years.
More and more traders and investors are active in the market, making the price mechanism much more slow-moving and adaptive in the traditional markets. This means that a steady bullish market in the US market can directly affect the crypto market and have correlation effects on it. In this case, the global financial market and stock exchanges seem to ignore the COVID-19 crisis and continue to grow, despite the weaknesses of the real economy.
This has a severe impact on the crypto economy as capital flows continue to enter the crypto market and deliver new results every time. The bullish trend continues from March 2020, when many countries imposed a lockdown and many people lost their jobs and got attracted from different ways of earning money like crypto trading. If the bullish market continues in the Bitcoin market, we will consider the scenario for a new all-time high level, even before 2021 become a reality. Until now, there is also the possibility of a correction move during the next days, that will indicate that some investors are happy with the return they achieved and liquidate their positions.
We can observe that the trading volumes are at normal levels, regarding the previous days, indicating that investors have a common sense towards the price development while the moving averages show no signal of turning back in a bearish trend or correction trend.

In the short-term diagram, we can observe that the first support level in a correction move will be held at $11,500, which was the first step in the current bullish trend and the major point for overcoming the stability mode around $10,500. This support level will be the first frontier that can hold a bearish trend from making Bitcoin's price to drop further and fuel another bullish wave in the future.
Indicators
MACD index continues to be around value = 150, indicating that Bitcoin is growing at tremendous rates every day, creating positive market momentum and giving the market the starting boost for everything needed for sustaining the bullish market. On the other hand, the RSI index remains around value = 60, indicating that the price will move towards a corrective move and make investors think the bears are hidden in the overvalued area.

Ethereum / US Dollar
Price Analysis
The $400 support/resistance level was held firmly during the last 2 days, creating long-term support for this point, which is probably to play a major role in the next periods for the Ethereum market. We believe that Ethereum, as it is strongly correlated with Bitcoin, might follow Bitcoin's bullish jump and continue to grow.
On the other hand, many analysts believe that Ethereum's previous success and the $480 top-level in early September create a lot of unnecessary value in the market, which is the reason for Ethereum's weakness to grow independently like it did in the previous bullish trend. We expect the price to reach $420 in the next days to keep up with the Bitcoin momentum and create new standards for the next period.
The trading volumes are held at lower levels, indicating that something might occur and make the price to turn up again while the moving averages are moving in parallel, creating no fear for the current situation.

Indicators
MACD index moved on the positive side with decreased power from the previous days, making some investors for its ability to grow further, without external help from Bitcoin. The RSI index lands at value = 60, showing that there is a possibility for more uptrend in the next days, with room to grow in the space.

Ripple / US Dollar
Price Analysis
If someone looks at Ripple, he will find out that the price seems not to be affected by anything that happens in the market. The price has been stagnated in the $0.25 point, creating a stable outlook for the next days. This is also a negative signal for the market as it cannot capitalize on the bullish momentum in the crypto market and grow at similar levels.
The $0.24 has been tested several times but there is also the $0.26 resistance level, which seems to be very competitive for Ripple investors. As we have highlighted several times in the previous days, the $0.26 point will be the start of the bullish trend in the Ripple market.
The trading volumes have plummeted during the last days while the moving averages, after crossing each other and forming a "Golden Cross", seem to be pretty close to each other, creating fears for another cross, this time a bearish one that will lead investors to misleading thoughts.

Indicators
MACD index moved again towards value = 0, indicating that the market has no evident direction and looks for the next move to happen that will shape the momentum. The same picture can be found on the RSI index as it moved near value = 50, showing no clear evidence about the price's next moves.

Litecoin / US Dollar
Price Analysis
As one of the winners in the current situation, Litecoin continues to surprise everyone and make winning moves. The last of these moves was that it stood up the $57 resistance level and turn it into a support level. Making a previous resistance level, a support level means that the market is driving the price to higher levels. This could happen in Litecoin's case as the next goal is $67, which is the 2020 high level.
If this point is reached in the next days, we will observe a situation with Bitcoin in the leading position and Litecoin in the second position, making it lucrative enough for more investors to enter and make this market, a winner in the crypto space. The trading volumes have been increasing every single day, creating more hype in the market while the moving averages are way apart from each other.

Indicators
MACD index is still growing every day, creating more positive momentum in the market and driving the price at higher levels. The RSI index came back to the "safe" zone as there is more stability in the market, comparing to previous days.

Bitcoin Cash / US Dollar
Price Analysis
Bitcoin Cash is making several moves in different directions, confusing investors that cannot predict its moves with certainty. The price lands at $270, making the previous support level in the past bullish period to match with this. We believe that reaching $280, it will be the point for Bitcoin Cash to be on the bullish trend again.
This scenario could be supported this time from the trading volumes that have some spikes from time to time and make investors a little more optimistic about the next period. The moving averages are continuously moving in parallel positions, indicating certain stability in the future price formation.

Indicators
MACD index continues to move on the positive side, making investors think optimistic about the price development while the RSI index is giving bullish signals, landing at value = 60, which gives room for uptrend during the next days.

Correlations
Bitcoin / Ethereum = 0.90 (- 0.03), Bitcoin / Ripple = 0.31 (- 0.08), Bitcoin / Litecoin = 0.91 (+ 0.01), Bitcoin / Bitcoin Cash = 0.82 (- 0.04)
The correlations have started to move in mixed directions during today's session as Ethereum and Litecoin have made their way on the strong side for correlation, creating a background for following Bitcoin (even at delay) during the next days. Bitcoin Cash is still in confusion about what will lead its next day but it remains in the "strong" zone about correlation effect. On the other hand, Ripple seems to change its mind every mind, dropping even more during today's session. If the rest of the market will follow Bitcoin in the late jump, that could be determined from the formed correlations, making Ethereum and Litecoin, the most possible followers after a couple of days.
Key Notes For Today
Bitcoin take another jump in the price, continuing the bullish trend
Litecoin was the only coin that followed this jump
Ethereum and Bitcoin Cash made positive moves with a small impact on the price formation
Ripple stand-alone and stable, without getting affected by the overall trend



