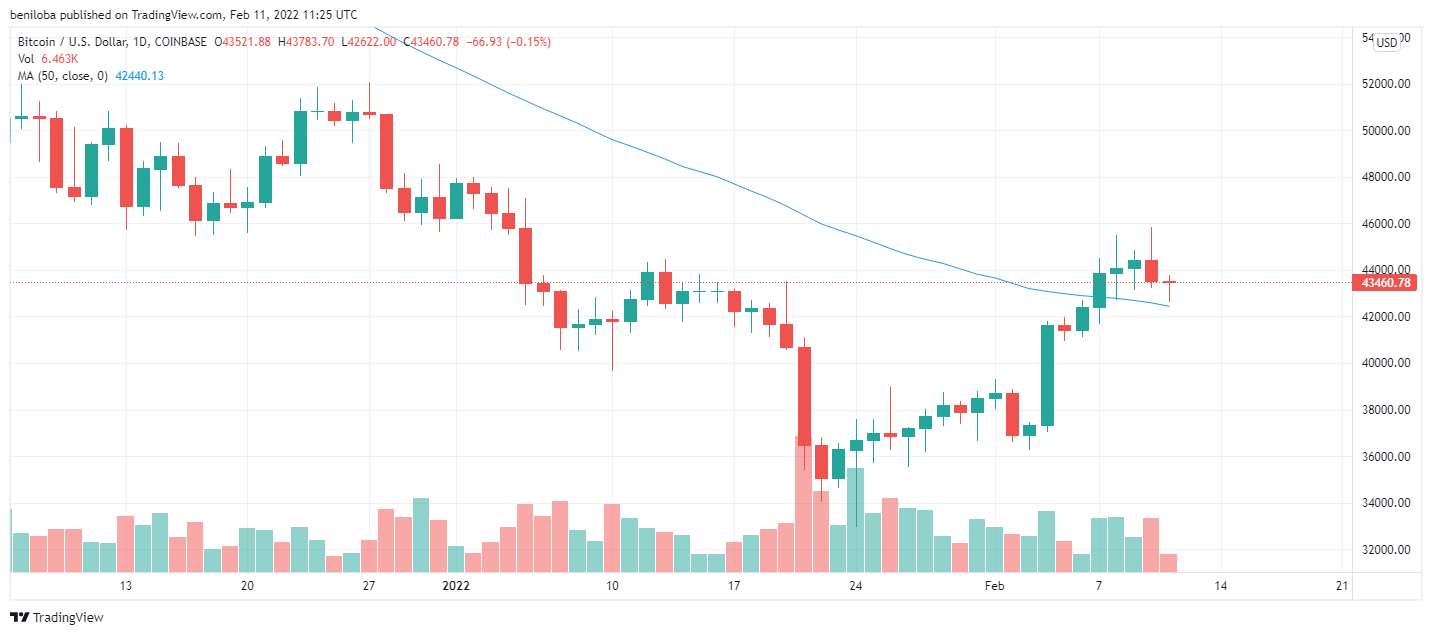
At the start of the 11th of February, we see a heavily contested market as the bulls are trying to resist the bearish start to the day. From the above chart, we see increased selling volumes, resulting in a bearish dominance of the market at its start; however, with significant bullish resistance, the loss seen on this day is so far limited to 0.15%, bringing the Bitcoin price to $43,460 per coin. With this move, the bears lead the market, but with so much time left, we could see a shift in the market momentum. Nevertheless, as at the writing of this piece, the highest and lowest Bitcoin trading price for the day stands at $43,783 and $42,622, respectively.
Over the last two days, it is evident that the Bitcoin bears are aiming to gain control of the market, which can be achieved by bringing the market below its 50-day moving average of $42,438 and sustaining the market below this level.
Indicator
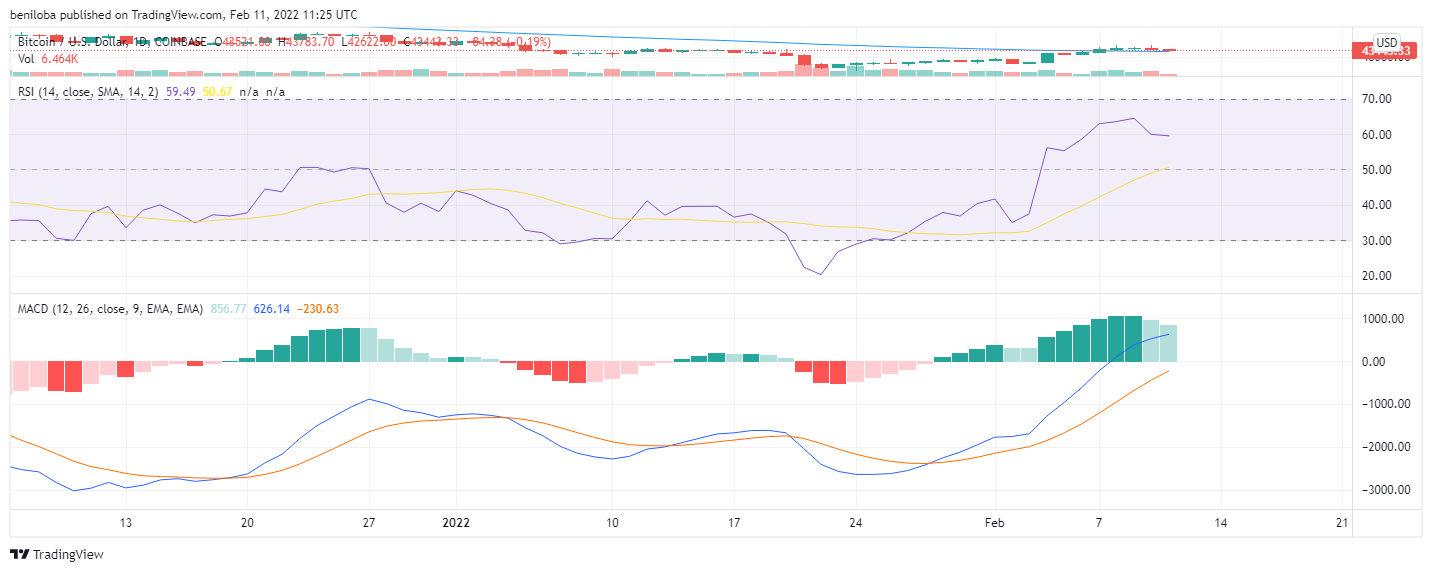
Despite the bearish action over the last two days, the Bitcoin market remains bullish, as indicated by the relative strength index above the 50 mark. On the 10th of February, the bearish action resulted in a fall of the RSI to 59.92. With the sustained but contested bearish start to the 11th of February, we see the relative strength index fall to 59.49, reflecting the bears struggling to gain control of the market.
The histogram remains bullish; however, we see reduced bullish activity on the 10th and 11th of February. In correlation with other indicators, the MACD places above the zero line, indicating a positive outcome for the asset.
Buy and sell BTC on Remitano
Ethereum / US Dollar
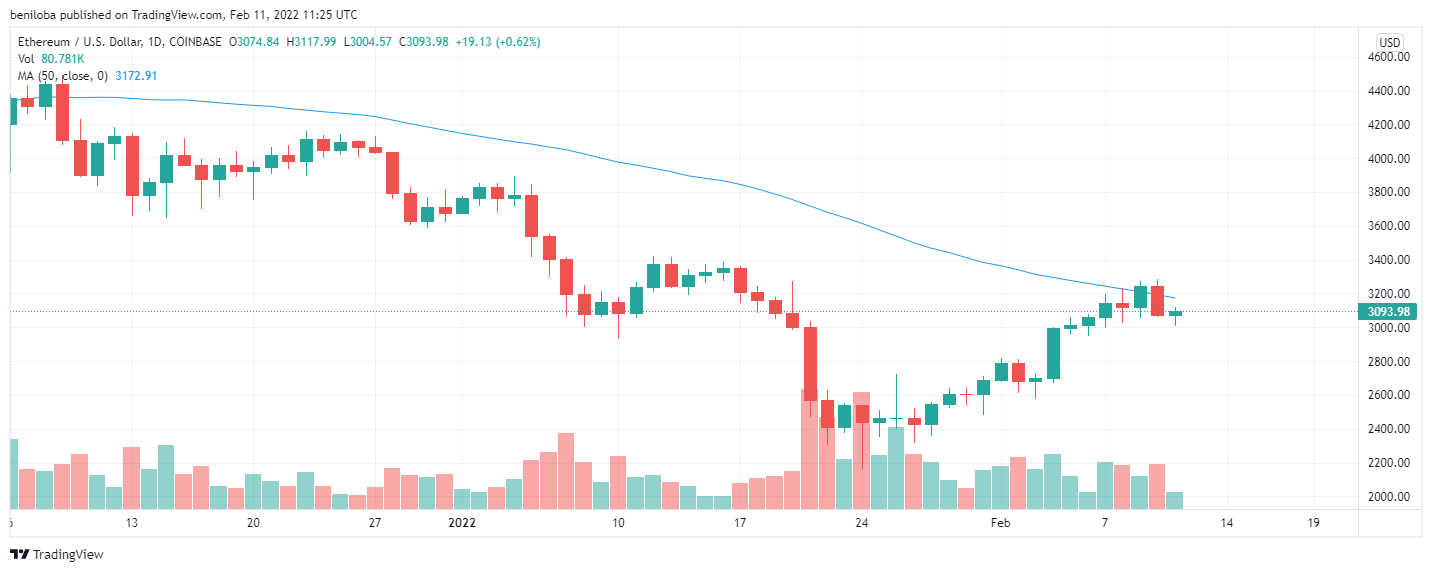
As with the Bitcoin market, we see the Ethereum market experience massive bearish action on the 10th of February, resulting in the market falling below its 50-day moving average of $3,172, temporarily placing the market in bearish favor. With the bearish move on this day, the bears influenced a 5.28% drop, placing the ETH price at $3,074 per coin in a move that suggests the bears gained control following a successful takeover from the bulls as indicated by the wick above the candle, denoting the highest and lowest trading price point for the day at $3,284 and $3,057, respectively.
Following the bearish action of the previous day, we see the bulls initiating a pushback on the 11th of February in an attempt to get the market back above its 50-day average. With this move, the ETH price is up 0.62%, translating to $3,093 per coin. With the market still far from its close, we expect to see more activity, subjecting values seen during the day to change. Nevertheless, as at the writing of this piece, the highest and lowest ETH trading prices for the day stand at $3,117 and $3,004, respectively.
Indicators
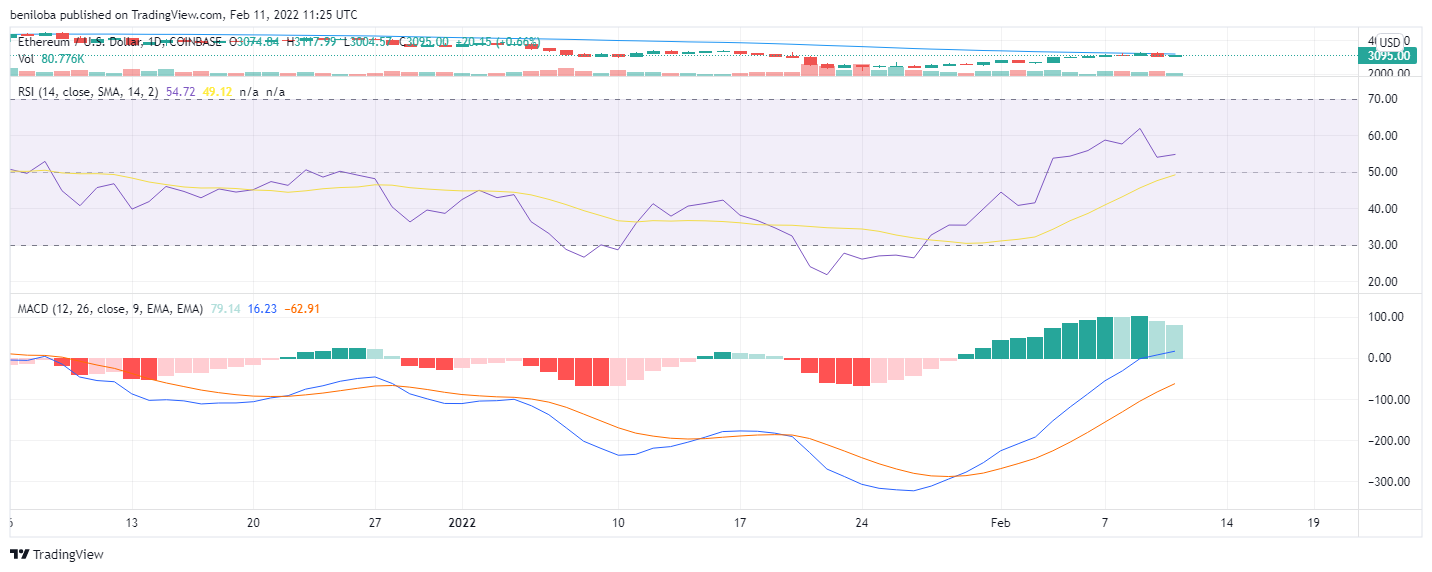
With the bearish action on the 10th of February, the relative strength index shows a fall to 53.95, reflecting increased selling action on the day. With the bulls attempting to revive the market on the 11th of February, we see the relative strength index stop its descent, standing at 54. Despite the bearish action, the ETH market remains bullish, as indicated by the values over the last two days standing above the 50 mark.
In correlation to the relative strength index, the histogram and MACD remains bullish as they stand above the zero line though reflecting the recent bearish action over the last two days as reduced bullish action, maintaining the positive outlook for the asset.
Buy and sell ETH on Remitano
Ripple / US Dollar
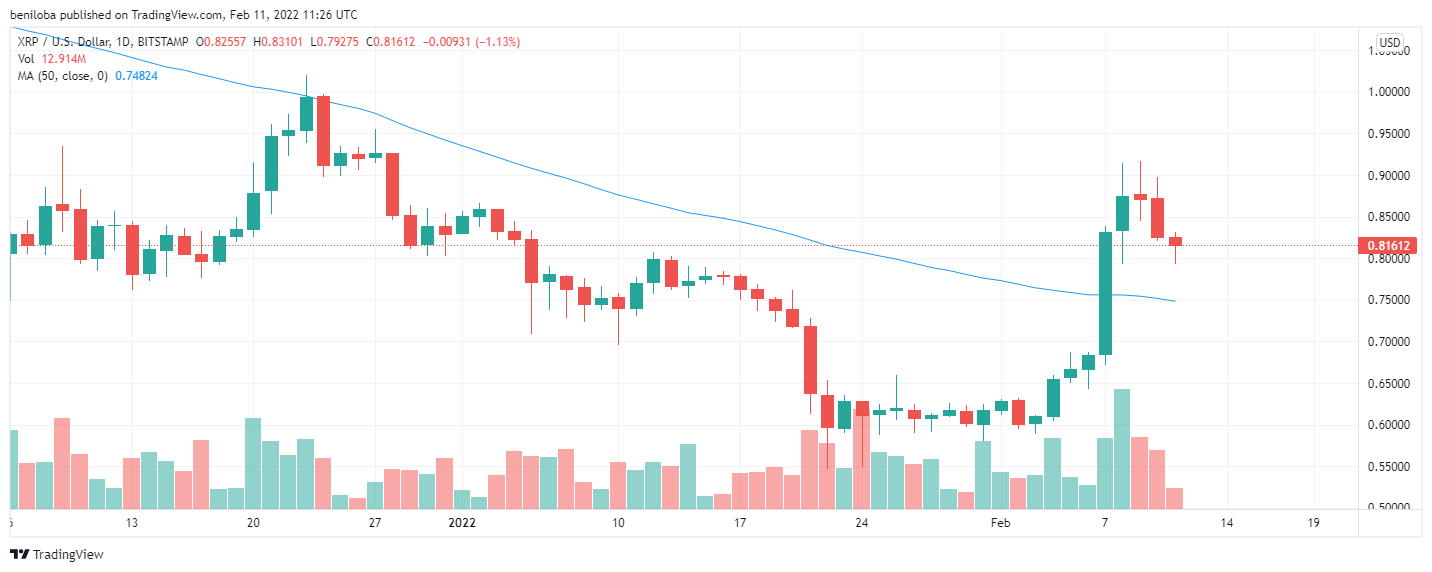
The above chart shows that the Ripple market has experienced consecutive bearish action over the last three days. On the 10th of February, the bears reestablished their previous momentum after successfully challenging the bulls for market dominance, as indicated by the wick above the candle. The Ripple market fell by 5.21%, bringing the XRP value to $0.825 per coin with their momentum. The wick below the candle indicates bullish rejection of further downward action in the market in an attempt to minimize losses; however, the bulls were not successful in reducing the loss, placing the lowest XRP trading price for the day at $0.820 per coin, while the highest trading price for the day stands at $0.831 per coin.
We see the bears continuing their effort in bringing the Ripple market below its 50-day moving average by influencing a 1.13% drop in the XRP price at the start of the 11th of February, bringing the XRP price to $0.816 per coin. The large wick below the candle suggests bullish rejection to further price fall, and with the market far from its close for the day, we could see more action, which might see the bears lose their grasp on the market. Nevertheless, as at the writing of this piece, the highest lowest XRP trading prices achieved so far stand at $0.831 and $0.792, respectively.
Despite the bearish action seen over the last three days, the Ripple market remains bullish as it trades well above its 50-day moving average.
Indicators
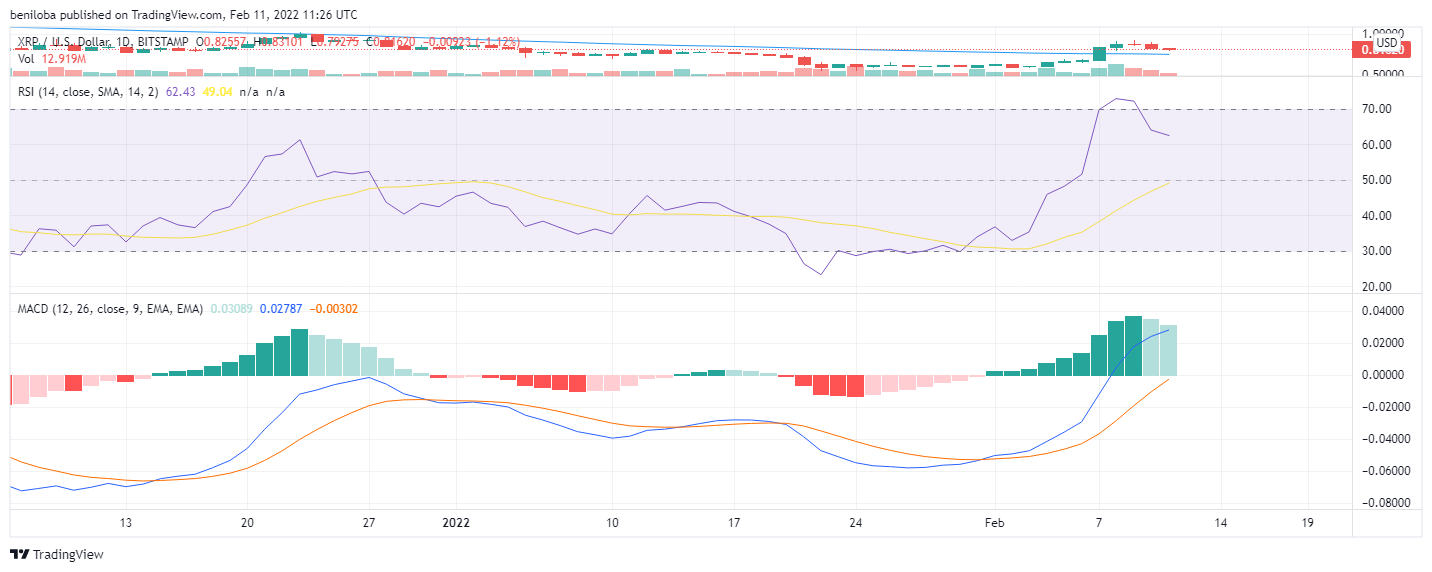
With the bearish action over the last few days, the Ripple market has now fallen from an overbought market. However, the Ripple market remains bullish despite this bearish action, as indicated by the relative strength index being above the 50 mark. On the 10th of February, the bearish action resulted in a fall of the RSI to 63. With the sustained but contested bearish start to the 11th of February, we see the relative strength index fall to 62, reflecting the bears struggling to gain market control.
The histogram remains bullish; however, we see reduced bullish activity on the 10th and 11th of February. In correlation with other indicators, the MACD places above the zero line, indicating a positive outcome for the asset.
Buy and sell XRP on Remitano
Litecoin / US Dollar
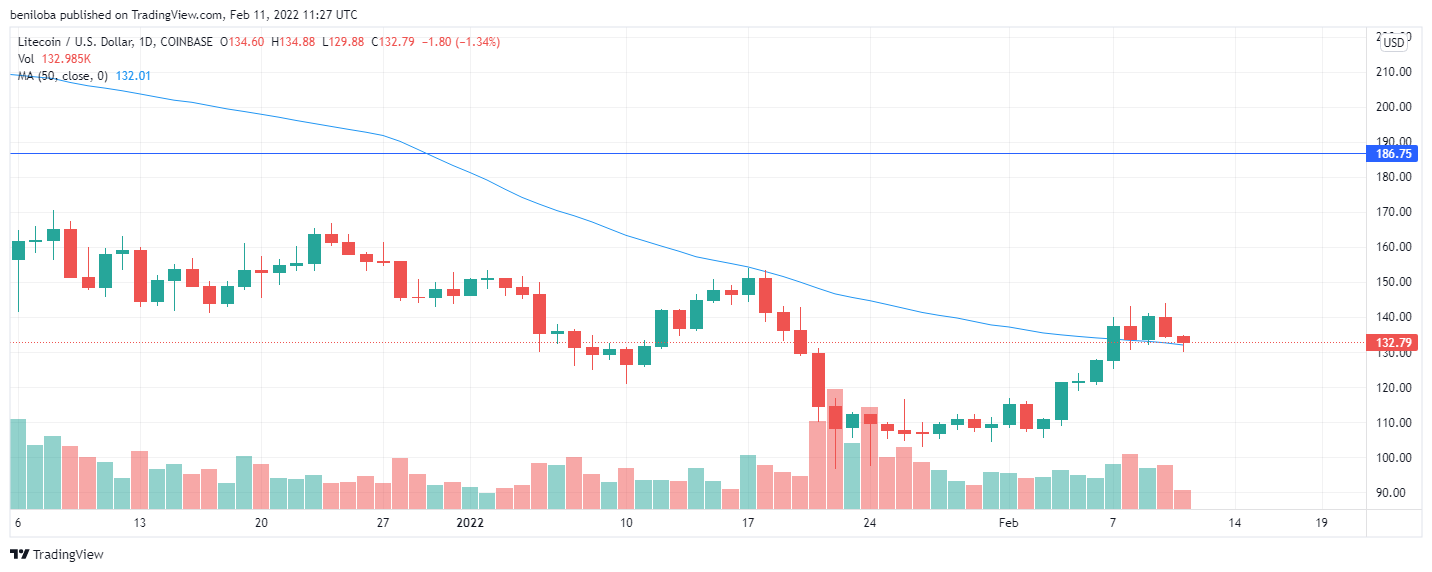
The above chart shows that the Litecoin market has experienced consecutive bearish action over the last two days. On the 10th of February, the bears initiated a push-back momentum after successfully challenging the bulls for market dominance, as indicated by the wick above the candle. The LTC market fell by 3.99%, bringing the LTC value to $134 per coin with their momentum. The wick below the candle indicates bullish rejection of further downward action in the market in an attempt to minimize losses; however, the bulls were not successful in reducing the loss, placing the lowest LTC trading price for the day at $134 per coin, while the highest trading price for the day stands at $143 per coin.
We see the bears continuing their effort in bringing the LTC market below its 50-day moving average of $132 per coin by influencing a 1.34% drop in the LTC price at the start of the 11th of February, bringing the LTC price to $132 per coin. The wick below the candle suggests bullish rejection to further price fall to a level below the market’s 50-day moving average, and with the market far from its close for the day, we could see more action, which might see the bears lose their grasp on the market. Nevertheless, as at the writing of this piece, the bulls are fighting to keep the market above its 50-day moving average, placing the highest lowest LTC trading prices achieved so far stand at $134 and $132, respectively.
Indicators
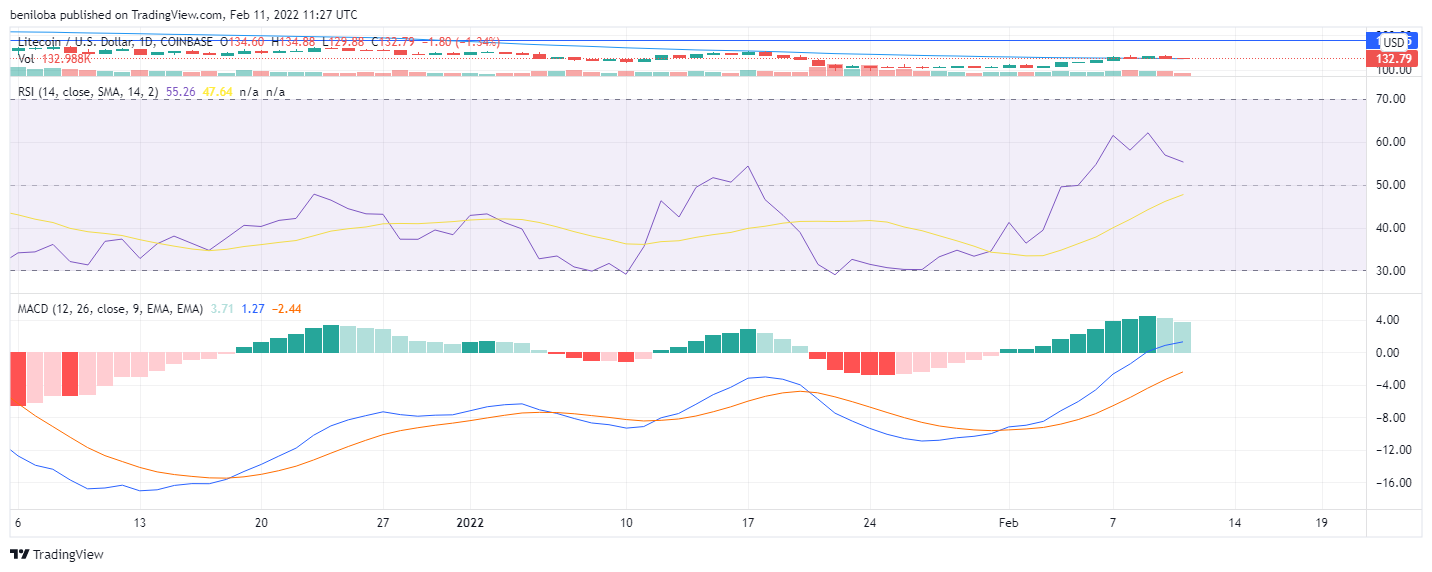
Due to the sustained bearish action in the Litecoin market over the last two days, we see the relative strength index of Litecoin fall. However, the Litecoin market remains bullish despite this bearish action, as indicated by the relative strength index being above the 50 mark. On the 10th of February, the bearish action resulted in a fall of the RSI to 56. With the sustained but contested bearish start to the 11th of February, we see the relative strength index fall to 55, reflecting the bears struggling to gain market control.
The histogram remains bullish; however, we see reduced bullish activity on the 10th and 11th of February. In correlation with other indicators, the MACD places above the zero line, indicating a positive outcome for the asset.
Buy and Sell LTC on Remitano
Bitcoin Cash / US Dollar
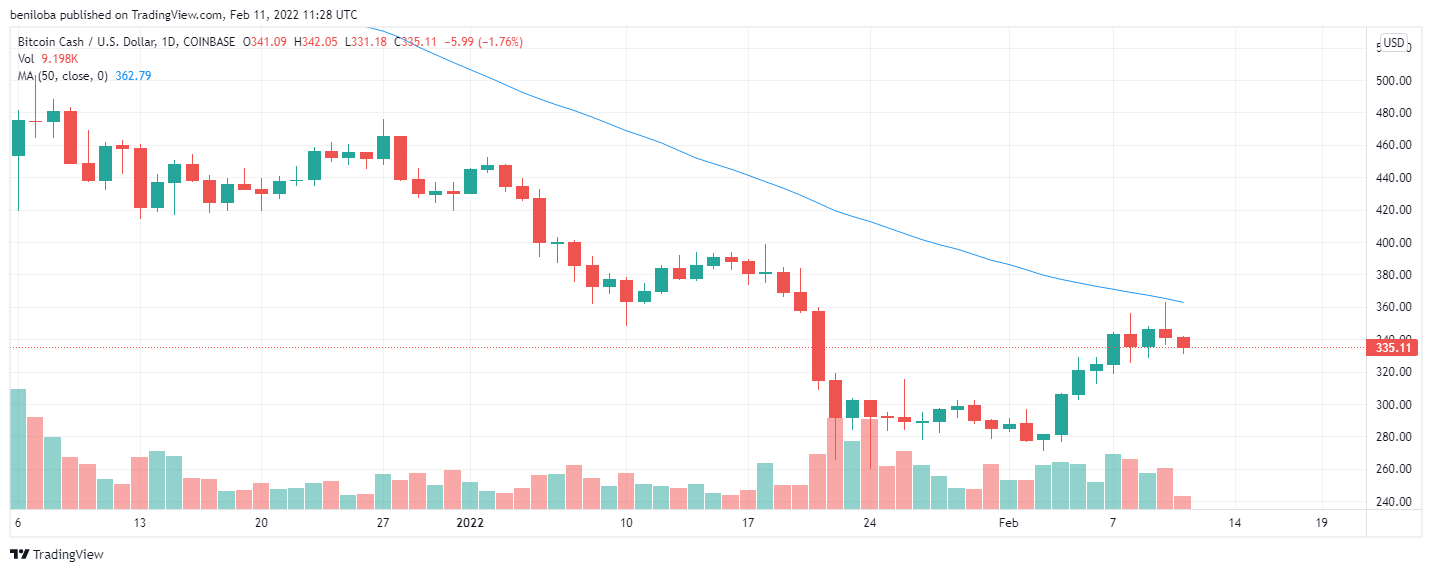
As with most of the crypto market over the last two days, the Bitcoin Cash market has experienced bearish activity, faltering bullish attempts at getting the market back above its 50-day moving average of $362 per coin. On the 10th of February, the bears flipped an initial bullish momentum as indicated by the wick above the candle, which also denotes the highest trading price of BCH of the day at $362 per coin. With the successful bearish start to the market, the bears influenced a 1.48% drop in the Bitcoin Cash price, bringing the price of each coin to $341. The chart also illustrates the bullish rejection of further bearish action. They attempted to minimize the losses seen on the day, indicated by the wick below the candle and placing the lowest price of Bitcoin Cash for the day at $336 per coin.
At the start of the 11th of February, we see the bears continuing their previous day's momentum. However, with bullish resistance, the loss seen on this day is so far limited to 1.76%, bringing the Bitcoin Cash price to $ per 335. With this move, the bears lead the market, but with so much time left, we could see a shift in the market momentum. Nevertheless, as at the writing of this piece, the highest and lowest Bitcoin Cash trading price for the day stands at $342 and $331, respectively.
Indicators
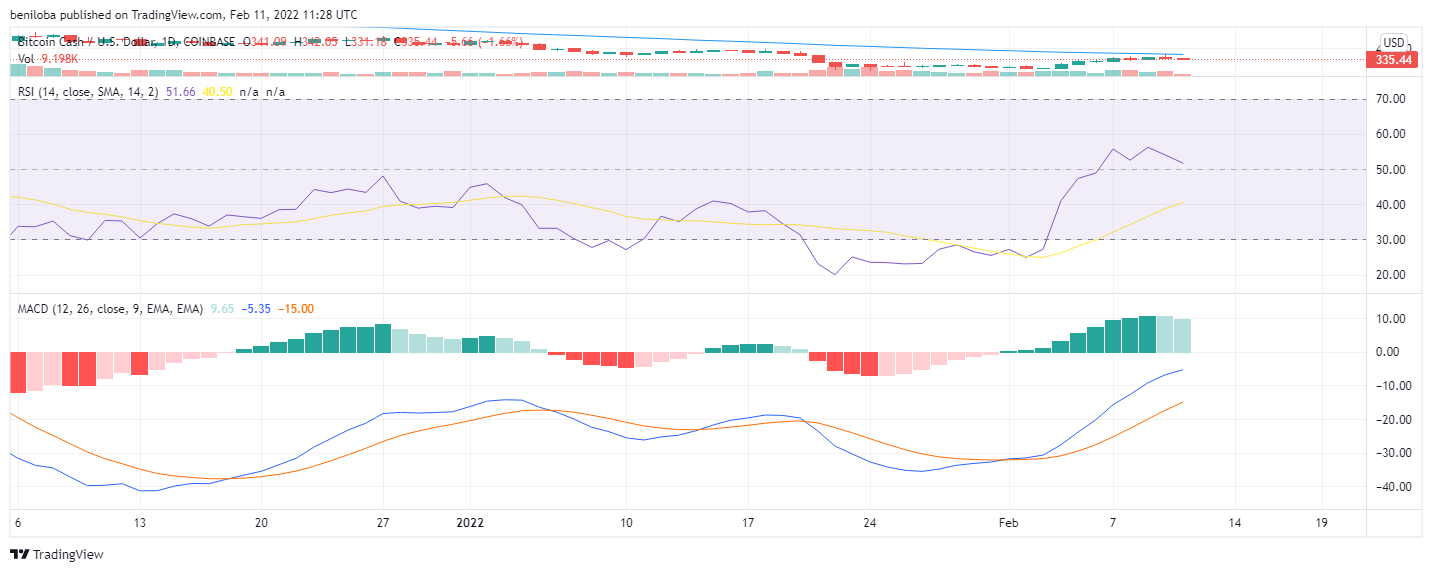
On the 10th of February, the bearish action resulted in a fall of the relative strength index to 54, and with the sustained but contested bearish start to the 11th of February, we see the relative strength index fall to 51, reflecting the bears struggling to gain control of the market.
Despite the bearish action over the last two days, the Bitcoin Cash market remains bullish, as indicated by the relative strength index above the 50 mark.
The histogram remains bullish; however, we see reduced bullish activity on the 10th and 11th of February. In correlation with other indicators, the MACD places above the zero line, indicating a positive outcome for the asset.
Buy and sell BCH on Remitano
Cardano / US Dollar
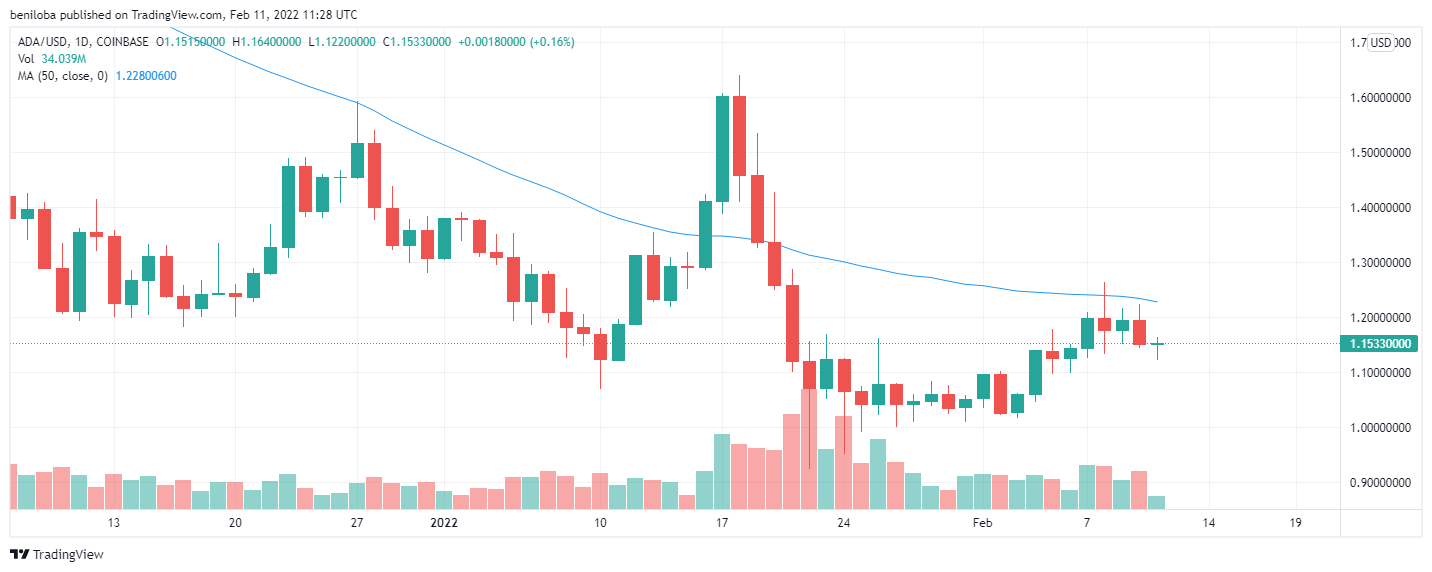
The ADA market remains below its 50-day moving average of $1.228 per coin, suggesting a market yet to break out of its downtrend. On the 10th of February, the bears toppled a bullish start to the day, as indicated by the wick above the candle, placing the highest trading price of ADA at $1.225 per coin. During the day, the bears influenced a 3.62% drop in price, bringing the ADA price to $1.144 per coin. We see the bulls initiating a move after rejecting an initial bearish momentum following the previous bearish day. With the market still hours from its close for the day, the market is likely to be more volatile; however, as at the writing of this piece, the ADA market is up by 0.16%, translating to a price of $1.153 per coin.
Indicators
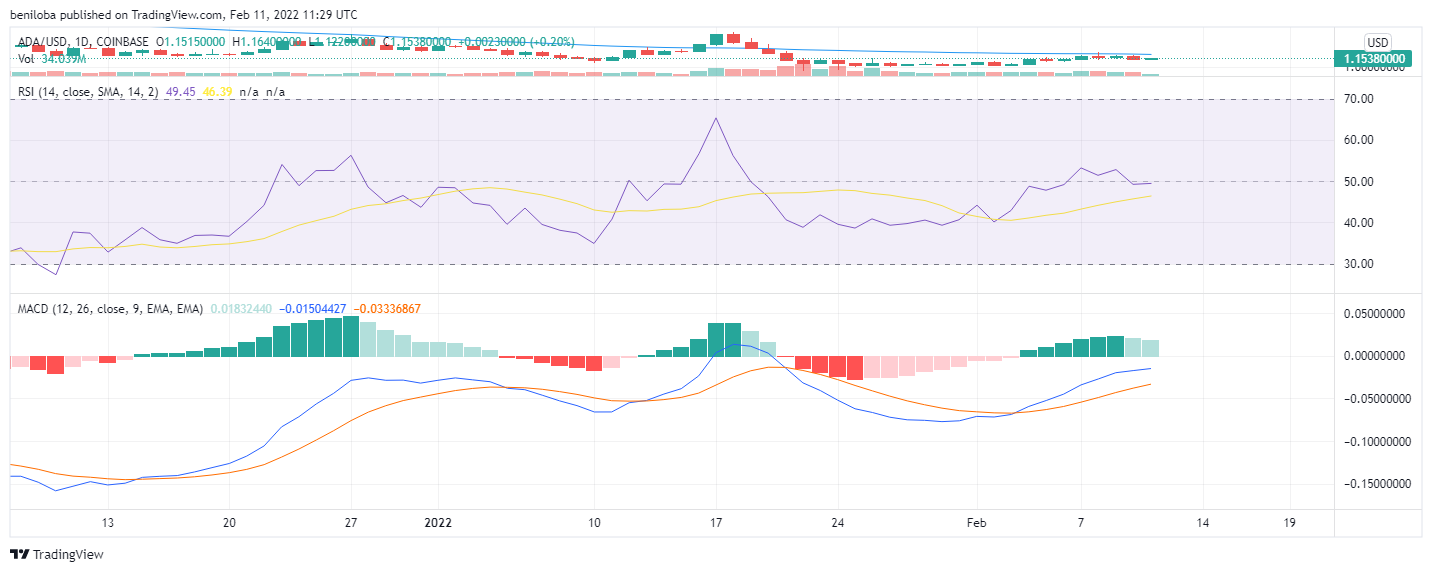
With the ADA bulls unable to establish a full momentum, the relative strength index over the last two days trades just below the 50 mark, at 49.22 on the 10th of February, and 49.45 on the 11th of February, indicating the bears have a slight hold on the momentum.
The MACD and histogram portray a market within bullish control but of reduced intensity due to the bearish action seen over the last few days.
Swap to ADA
Dogecoin / US Dollar
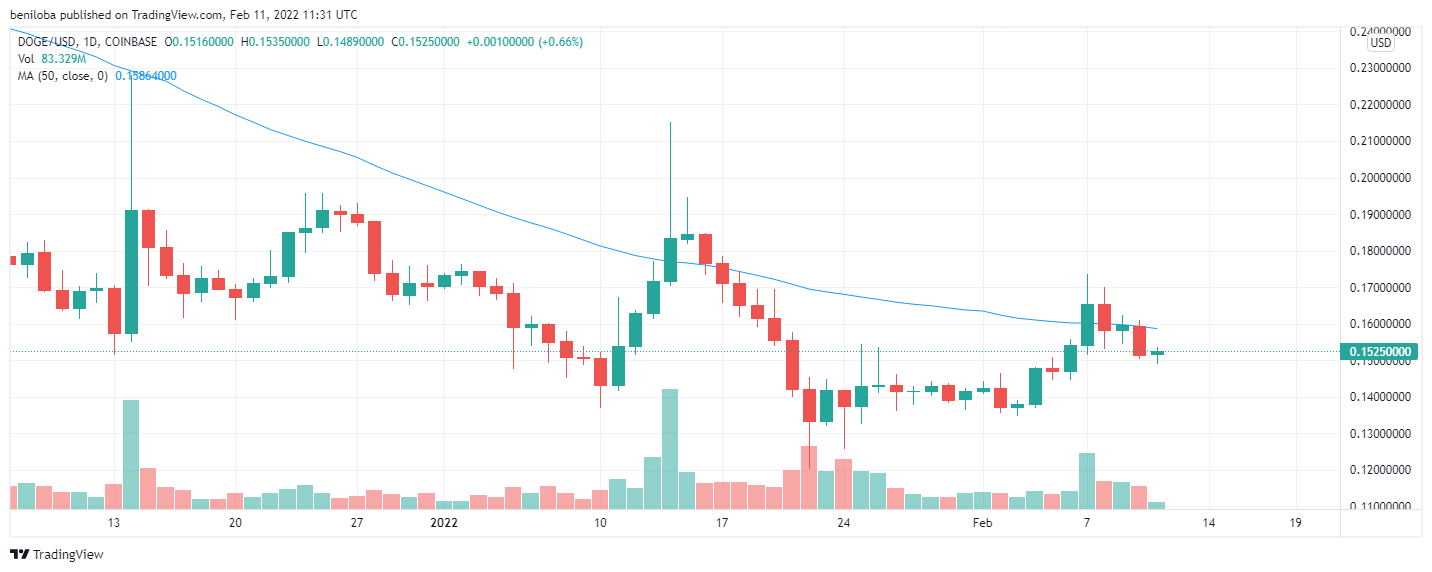
The Dogecoin market remains below its 50-day moving average of $0.158 per coin, suggesting a market yet to break out of its downtrend. On the 10th of February, the bears toppled a bullish start to the day as indicated by the wick above the candle, placing the highest trading price of Dogecoin for the day at $0.151 per coin, a 5.02% drop in price. We see the bulls initiating a move after rejecting an initial bearish momentum following the previous bearish day. With the market still hours from its close for the day, the market is likely to be more volatile; however, as at the writing of this piece, the Dogecoin market is up by 0.66%, translating to a price of $0.152 per coin.
Indicators
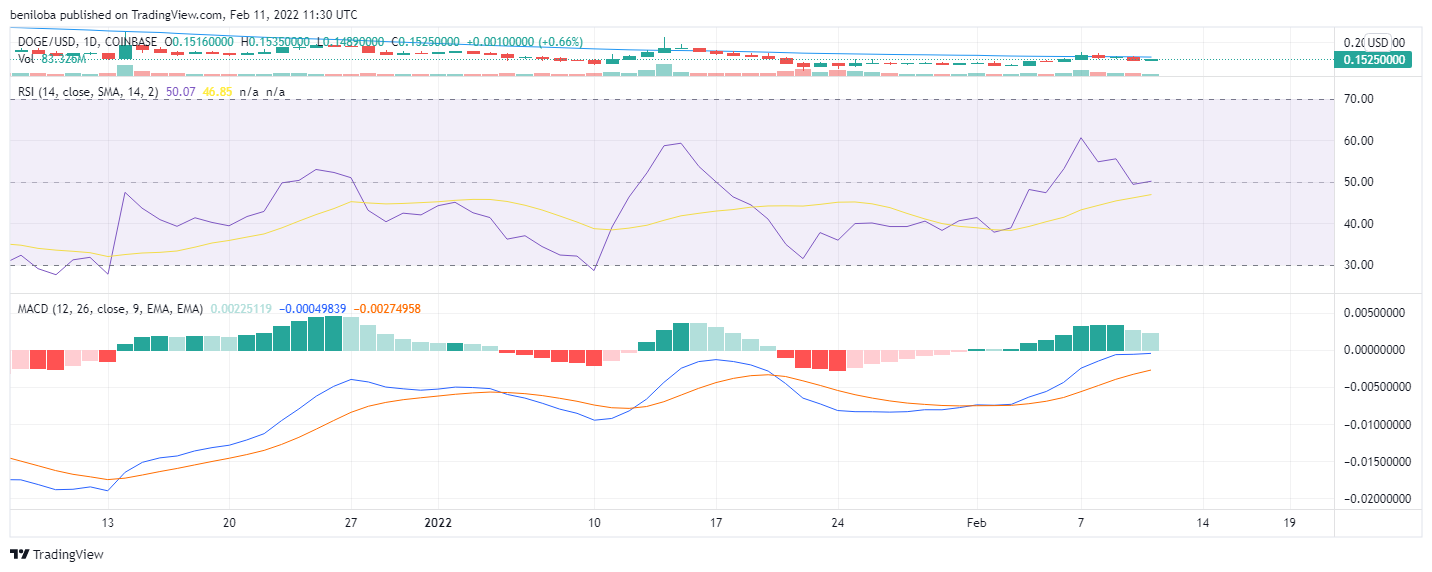
On the 10th of February, the bearish action brought the Dogecoin relative strength index down to 49, placing the bears at a slight advantage in the market momentum for the day. With the bullish start on the 11th of February, we see the relative strength index at 50, indicating momentary balance in the selling and buying pressure seen in the market.
The MACD falls slightly below the zero line, indicating a slight bearish dominance. However, the histogram shows that the bulls have the momentum, but the bearish action seen previously has significantly diminished the bullish effect.
Swap to DOGE
Correlations
- Bitcoin / Ethereum = 0.89
- Bitcoin / Ripple = 0.77
- Bitcoin / Litecoin = 0.88
- Bitcoin / Bitcoin cash = 0.81
- Bitcoin / Cardano = 0.86
- Bitcoin / Dogecoin = 0.88
Keynotes for today
- Bitcoin at $43,460 per coin.
- Ethereum at $3,093 per coin.
- Ripple at $0.816 per coin.
- Litecoin at $132 per coin.
- Bitcoin Cash at $335 per coin.
- Cardano at $1.153 per coin.
- Dogecoin at $0.152 per coin.