Bitcoin / US Dollar
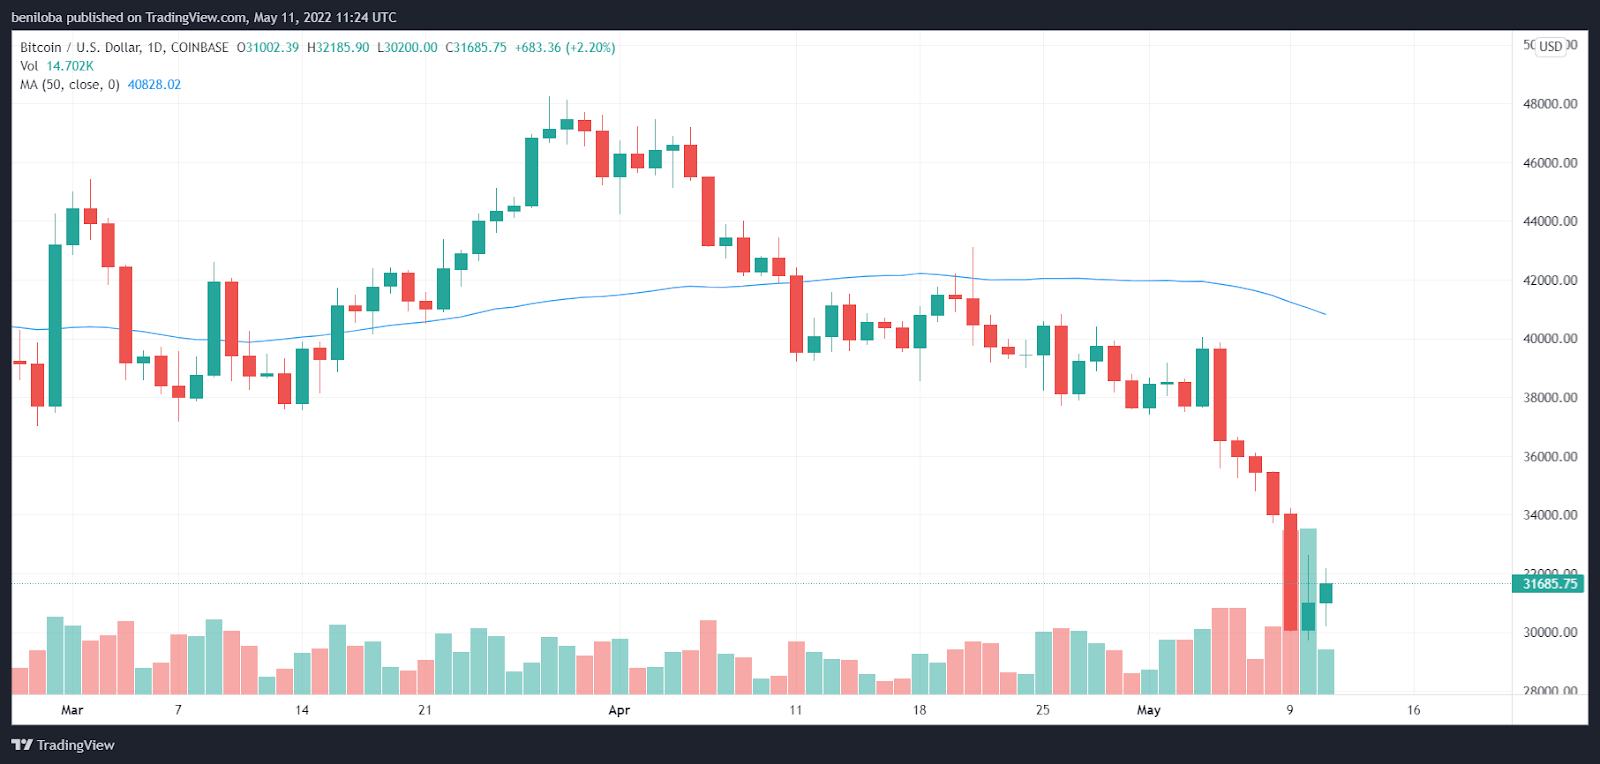
The Bitcoin price remains below its 50-day moving average of $40,828, signifying a market still yet to break out of a downtrend.
With the above move, the Bitcoin market experienced consecutive bullish action on the 10th and 11th of May, resulting in a 3.07% and 2.20% increase in the BTC price, an important step in maintaining the Bitcoin market above $30,000, a positive move in reviving the market. With the above, the Bitcoin prices on the 10th and 11th of May stood at $31,002 and $31,685 on these respective days.
Indicators
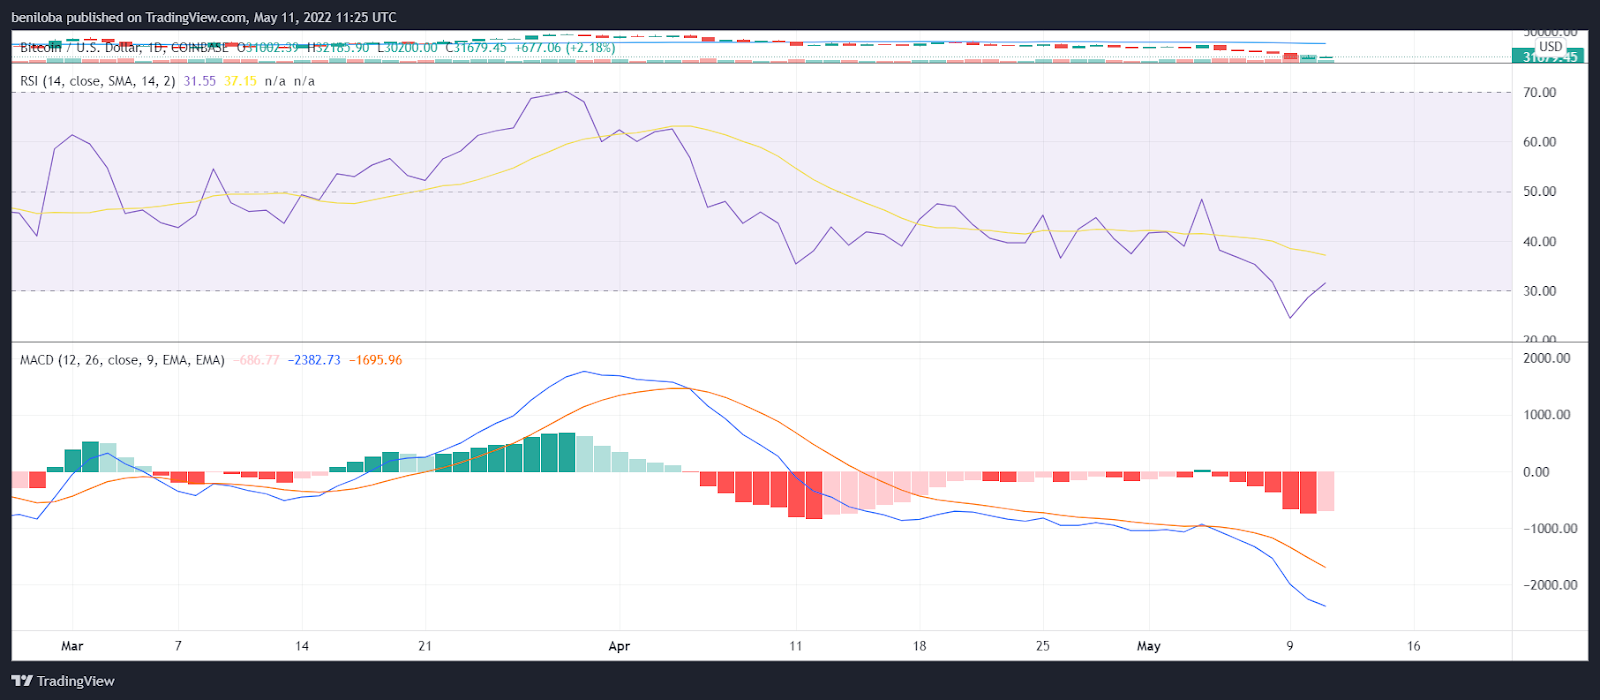
The consecutive bullish momentum on the 10th & 11th of May has brought the Bitcoin market out of the oversold region (RSI above 30). With the above, the RSI on these respective days stands at 28 and 31. With the RSI below 50, the bears remain the dominant force in the market.
The MACD and histogram remain below the zero line, indicating bearish control of the market momentum and a negative outlook for the asset. However, bullish action across these days reflects on these indicators as a reduction in the bearish momentum.
Buy and sell BTC on Remitano
Ethereum / US Dollar
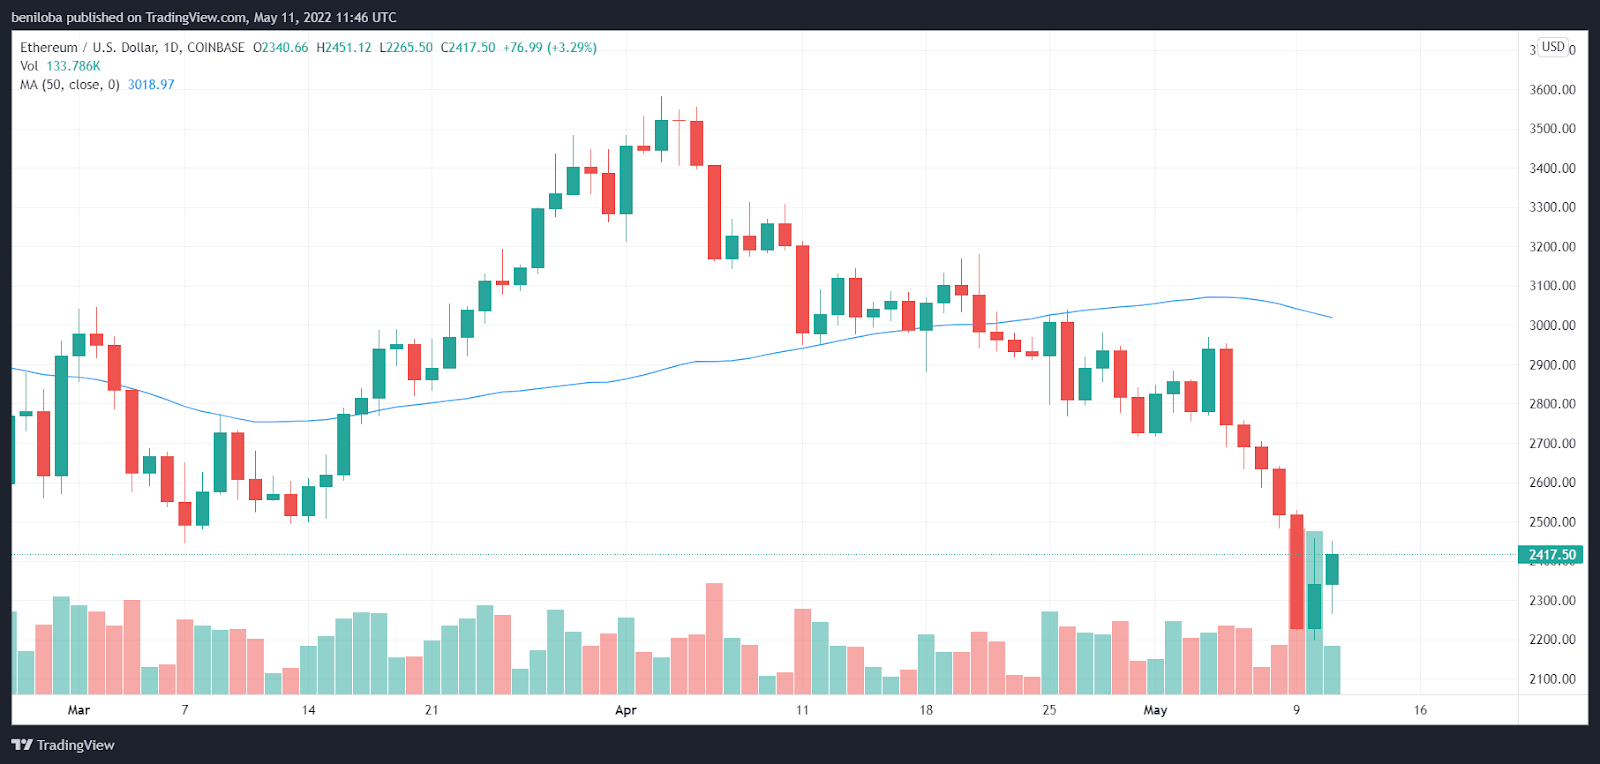
As with the Bitcoin market, we see the ETH market experience two consecutive days of bullish action, resulting in the ETH market gaining on its 50-day moving average of $3,018.
On the 10th of May, the bullish action resulted in the ETH rising by 5.03%, bringing the ETH price to $2,340 per coin.
On the 11th of May, the bulls are seen continuing their previous momentum to bring the ETH closer to its 50-day moving average, resulting in a 3.29% rise in the ETH price, translating to $2,417 per coin, with the highest and lowest price points being $2,451 and $2,265.
Indicators

With consecutive bullish action over the last two days, the relative strength index of the Ethereum market has risen out of the oversold region, with the RSI value being 32 and 36 on the 10th and 11th of May. With the above, the bears remain the dominant force in the market.
The MACD and histogram remain below the zero line, indicating bearish dominance of the market momentum.
Buy and sell ETH on Remitano
Ripple / US Dollar

The bears maintain market dominance with the market far from its 50-day moving average of $0.720.
The 10th of May sees bullish action with the above statement, resulting in a 5.38% rise in the Ripple price, bringing the XRP price to $0.513 per coin. On the 11th of May, the bears attempt to reignite their momentum, resulting in a 2.63% drop in the XRP price, corresponding to a price tag of $0.499 per coin, with the highest and lowest prices being $0.522 and $0.488 per coin.
Indicators
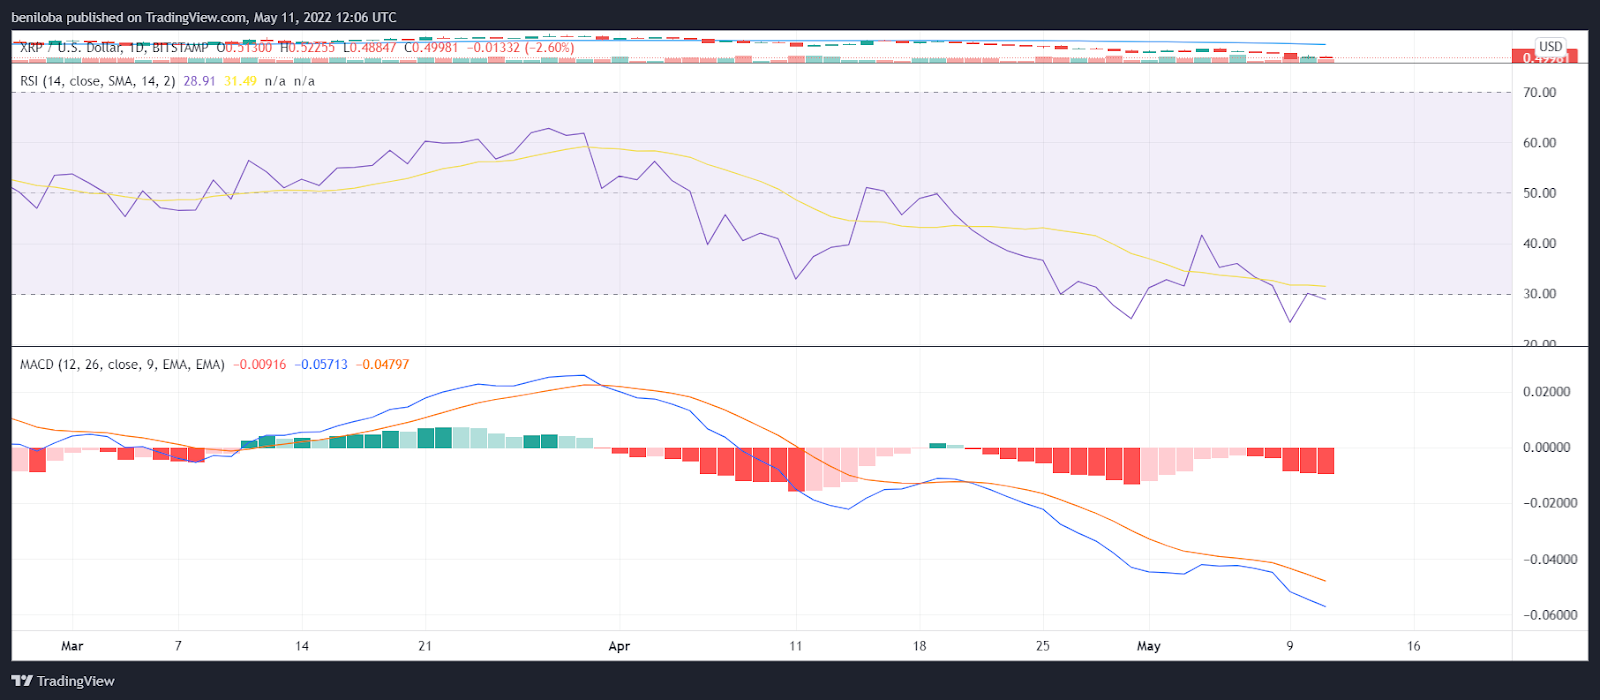
With the bears being the dominant force in the Ripple market, the relative strength index remains below 50. The bullish action on the 10th of May resulted in the RSI rising to 30, while the bearish action on the 11th of May has resulted in the RSI falling back into the oversold region at 28.
In correlation to the RSI, the histogram and MACD indicate a market is bearish as both indicators stand below the zero line, indicating a negative outlook for the asset.
[Buy and sell XRP on Remitano](https://remitano.com/xrp/
Litecoin / US Dollar

On the 10th of May, the bullish action resulted in the LTC market increasing by 5.16%, bringing the Litecoin price to $80 per coin.
On the 11th of May, the bears are seen initiating a response to previous bullish action, influencing a 0.86% drop in the LTC price, translating to $79 per coin. With much time before the end of the day, we could see increased volatility in the market.
Indicators

The RSI of the LTC market remains in the bearish region with a value below the 50 markets. The RSI on the 10th and 11th of May stands at 31 and 30, respectively.
In agreement with the RSI, the MACD and histogram show bearish activity in the market, providing a negative outlook for the asset.
Buy and Sell LTC on Remitano
Bitcoin Cash / US Dollar

On the 10th of May, the bulls gained market control after rejecting a bearish head start to the day, resulting in the market rising by 6.31%, translating to $231 per coin with the above move. We see the bears responding on the 11th of May, resulting in a 2.08% drop in the Bitcoin Cash price to $226 per coin. The highest and lowest Bitcoin price stood at $249 and $216, respectively. The Bitcoin Cash market remains well below its 50-day moving average of $322 per coin, maintaining the market in a downtrend.
Indicators
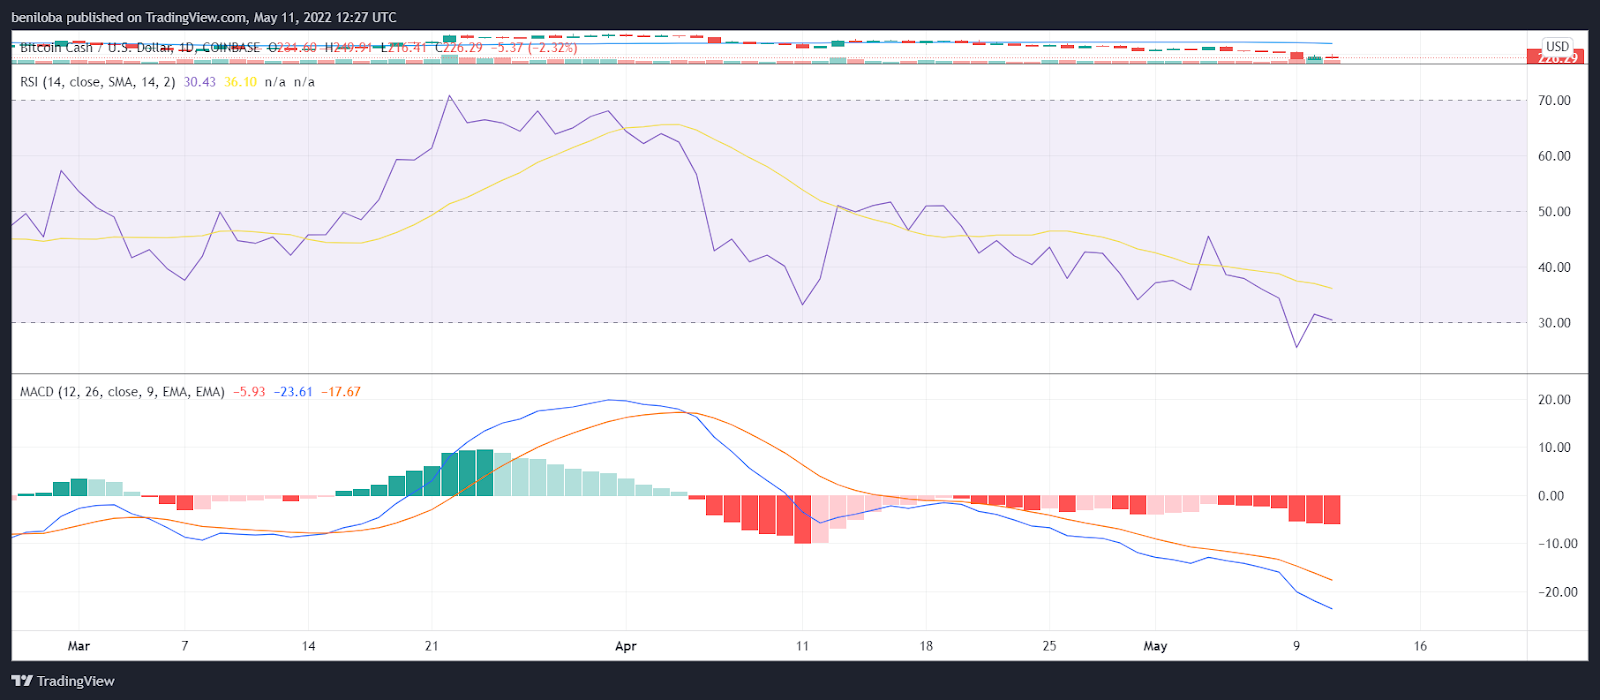
The BCH relative strength index portrays a market in bearish control with a value below the 50 mark. On the 10th of May, the bullish action resulted in an RSI of 31, while the bearish action on the 11th of May resulted in an RSI of 30.
The MACD and histogram remain below the zero line, maintaining the bears in control and a negative outlook for the Bitcoin Cash market.
Buy and sell BCH on Remitano
Cardano / US Dollar

The ADA market remains below its 50-day moving average of $0.976, maintaining that the bears control the market momentum.
On the 10th of May, the bulls began a momentum, resulting in a 4.40% rise in the market, bringing the ADA price to $0.628 per coin. On the 11th of May, we see the bears initiating a momentum resulting in the ADA price dropping by 11.22%, bringing its price to $0.557 per coin.
'
Indicators

On the 10th of May, bullish price action saw the relative strength index rise to 31, while the bearish momentum on the 11th of May has resulted in an RSI of 29, bringing the ADA market into the oversold region.
The MACD and histogram show a bearish dominance, placed below the zero line, creating a negative asset for the market.
Swap to ADA
Dogecoin / US Dollar
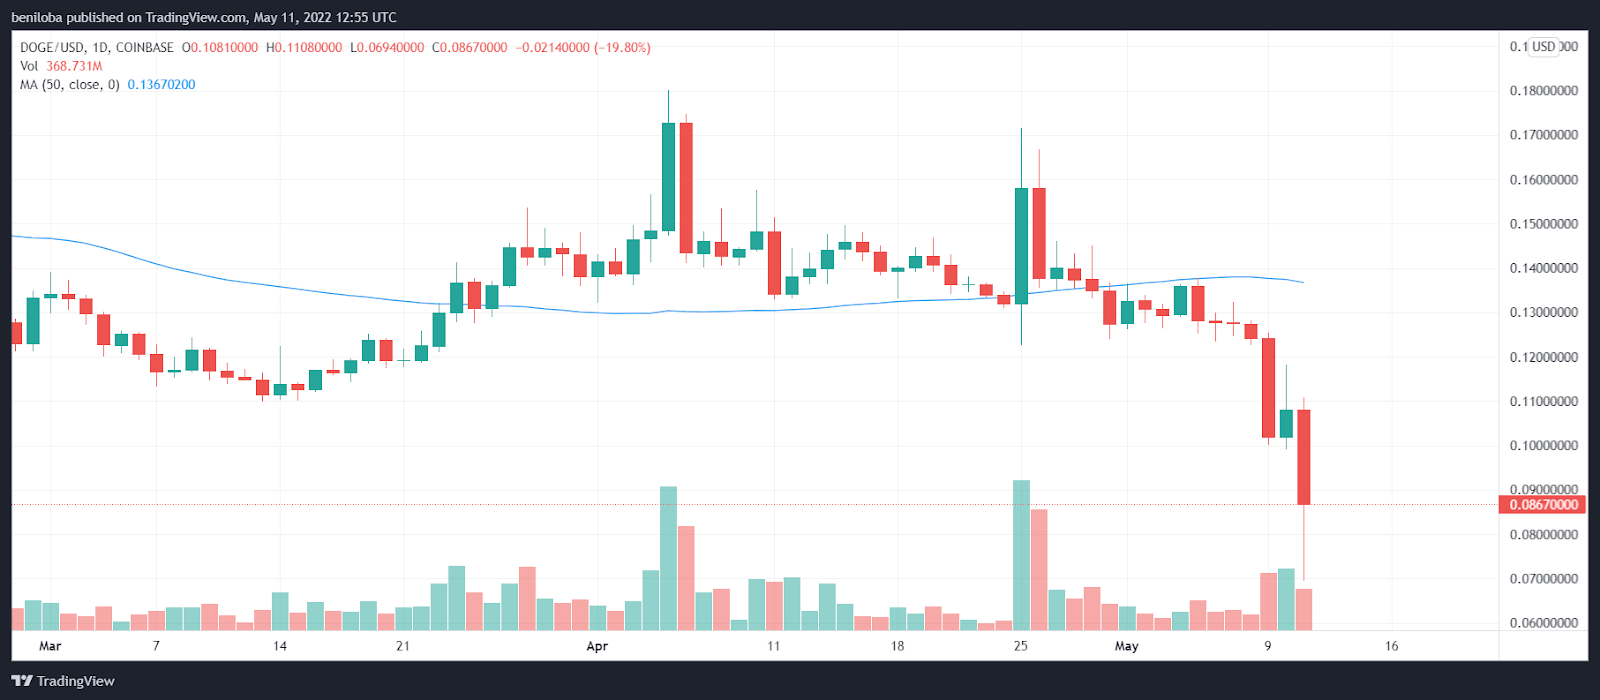
The bulls initiated a momentum on the 10th of May, resulting in a 6.08% rise in the Dogecoin price, translating to $0.108 per coin. The highest and lowest Dogecoin trading prices for the day stood at $0.118 and $0.099, respectively.
At the start of the 11th of May, we see massive bearish action, resulting in a 19.80% drop in the Dogecoin price, bringing its price to $0.086 per coin, with the highest and lowest trading prices standing at $0.110 and $0.069, respectively.
Indicators
On the 10th of May, the bullish action resulted in the RSI rising to 35, while the massive bearish action on the 11th of May resulted in an RSI of 27, bringing the DOgecoin market into the oversold region.
The MACD and Histogram show a bearish dominance, as both indicators are placed below the zero line, creating a negative asset for the market.
Swap to DOGE
Correlations
- Bitcoin / Ethereum = 0.95
- Bitcoin / Ripple = 0.74
- Bitcoin / Litecoin = 0.85
- Bitcoin / Bitcoin cash = 0.74
- Bitcoin / Cardano = 0.90
- Bitcoin / Dogecoin = 0.78
Keynotes for today
- Bitcoin at $31,685 per coin.
- Ethereum at $2,417 per coin.
- Ripple at $0.499 per coin.
- Litecoin at $79 per coin.
- Bitcoin Cash at $226 per coin.
- Cardano at $0.557 per coin.
- Dogecoin at $0.086 per coin.





