BITCOIN / U.S. DOLLAR
Price Analysis
Bitcoin still continues to consolidate between $10500 and $10000. The bulls seem to increase in strength as they try to take the price above the $10500 level, but some more momentum is required to push. The crucial $10000 support level is being strongly held by the bulls. Bitcoin reached a high point below the $10500 mark at $10,438 and closed the price at $10,405 on Friday, 11th September 2020. The bulls are trying to save the asset from going down below the $10000 level by buying the low at $10,197 today. As the fifty-day MA goes on sloping up and crosses above the twenty-day exponential MA and the basis (middle line) of Bollinger Bands, the bulls need to increase its momentum to take the asset back above the $11,000 resistance.

Key points to mark:
Immediate resistance that BTC is facing = $10,500. If bulls take the price above this level, it will test $10,824 (20 EMA) + $11,002 (basis of BB) + $11,239 (50 MA), followed by $11,500 before rising to $12,315.5 (upper BB) + $12,325 resistance levels.
Immediate support that BTC is facing = $10,000. If the price falls below this level, $9689 (lower BB) will be tested before Bitcoin declines to the $9500 support level.
Indicators
The MACD line moves in negative momentum below 0, along with the signal line. RSI has slightly sloped up and is out of the overbought zone at 41 with price corrections.

ETHEREUM / U.S. DOLLAR
Price Analysis
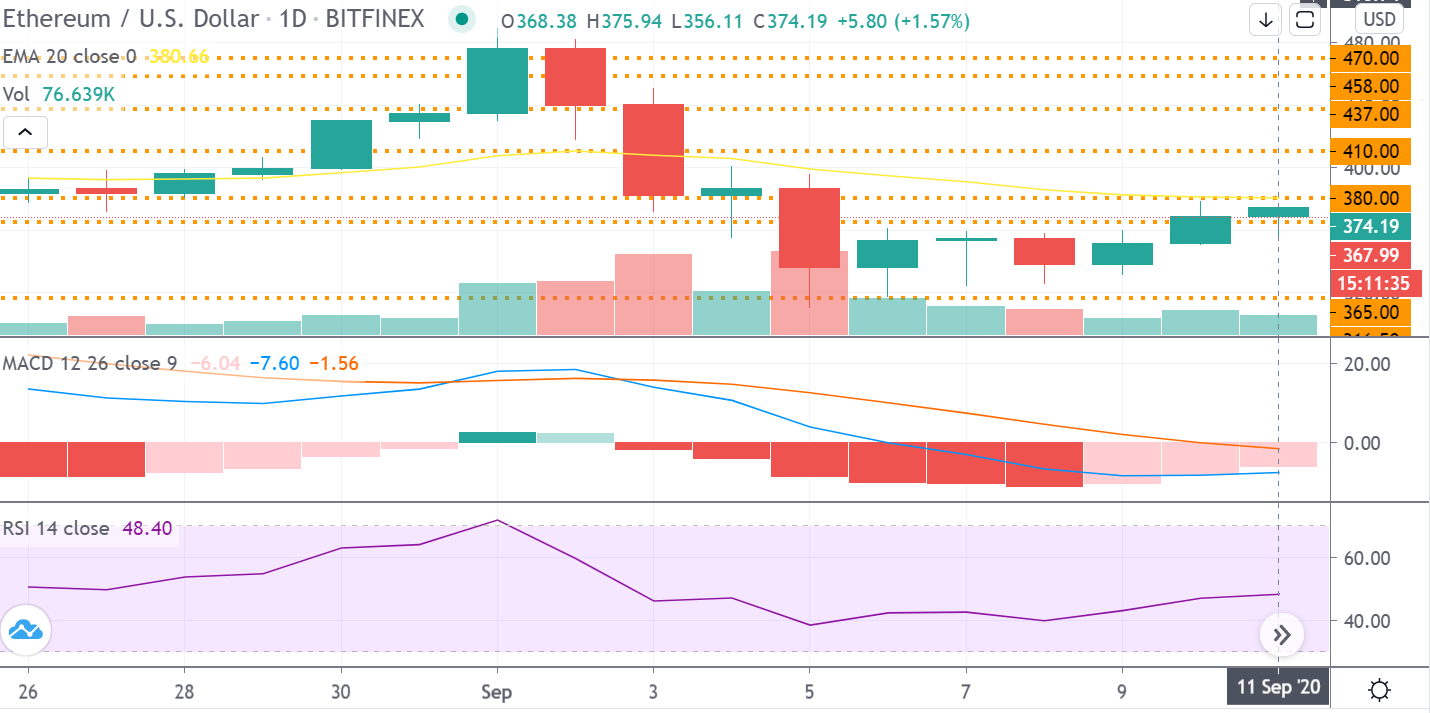
Ethereum finally rose above the $365 level with the bulls now aiming to push the price above the $380 resistance level. The bulls have increased their strength and made a high just a few points below the $380 level at $375.9 and closed the price at $374 on Friday, 11th September 2020. The bulls are currently not allowing the asset to slip down below the $365 mark by buying the low just a few points above it at $356 today. The fifty-day MA continues to slope up and has crossed above the twenty-day exponential MA almost touching the basis (middle line) of Bollinger Bands. Traders & investors who smartly invested in the Ethereum project are eagerly waiting for it to enter back into the upper half of the Bollinger Bands region.

Key points to mark:
Immediate resistance that ETH is facing = $380. If bulls can take the price above this level, ETH will test $380.6 (20 EMA) + $383 (50 MA) + $388.6 (basis of BB) before rising to $410 and then $437 resistance levels.
Immediate support that ETH is facing = $365. If bears push ETH below this level, it will test $318.5 (lower BB) + $316.5 before going down to test the $288.7 support level.
Indicators
The MACD line is moving in negative momentum below 0. The signal line has also crossed below 0 now. RSI has sloped up at 48, indicating that the bulls have the upper hand.
RIPPLE / U.S. DOLLAR
Price Analysis
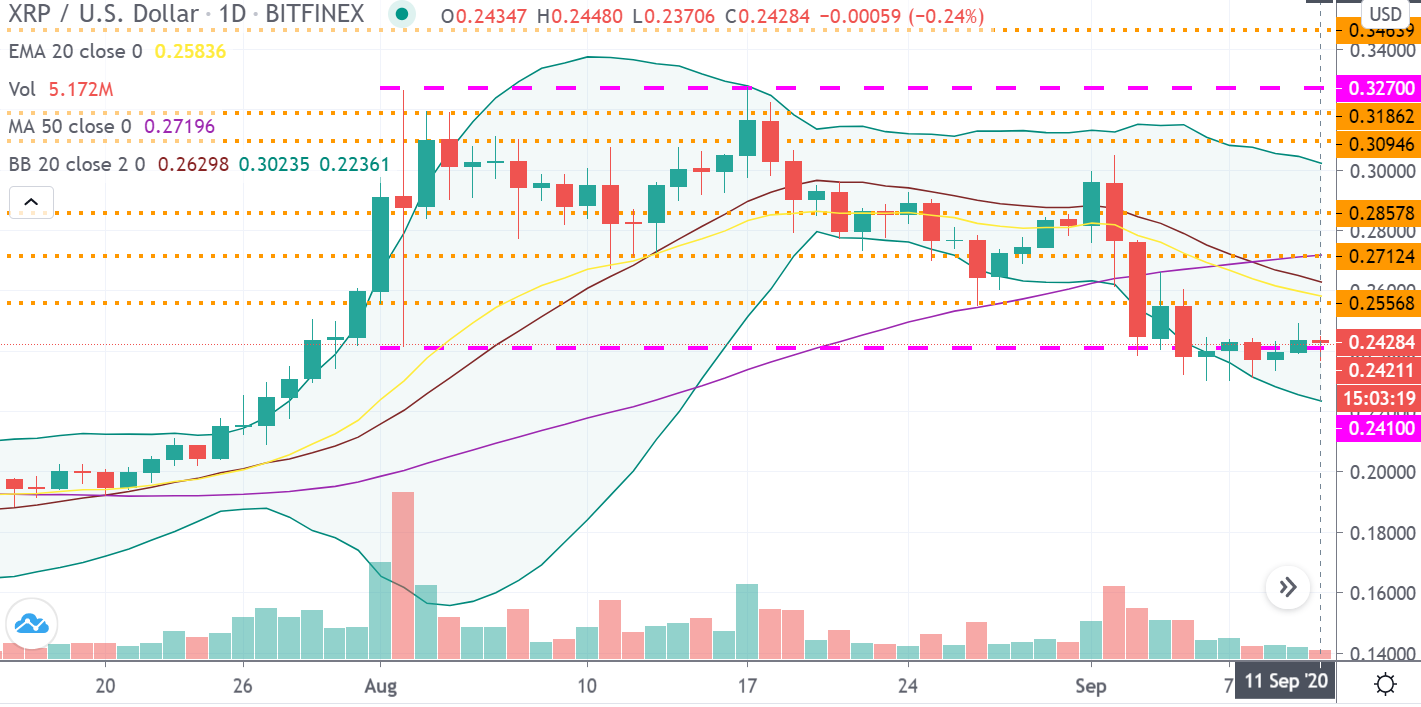
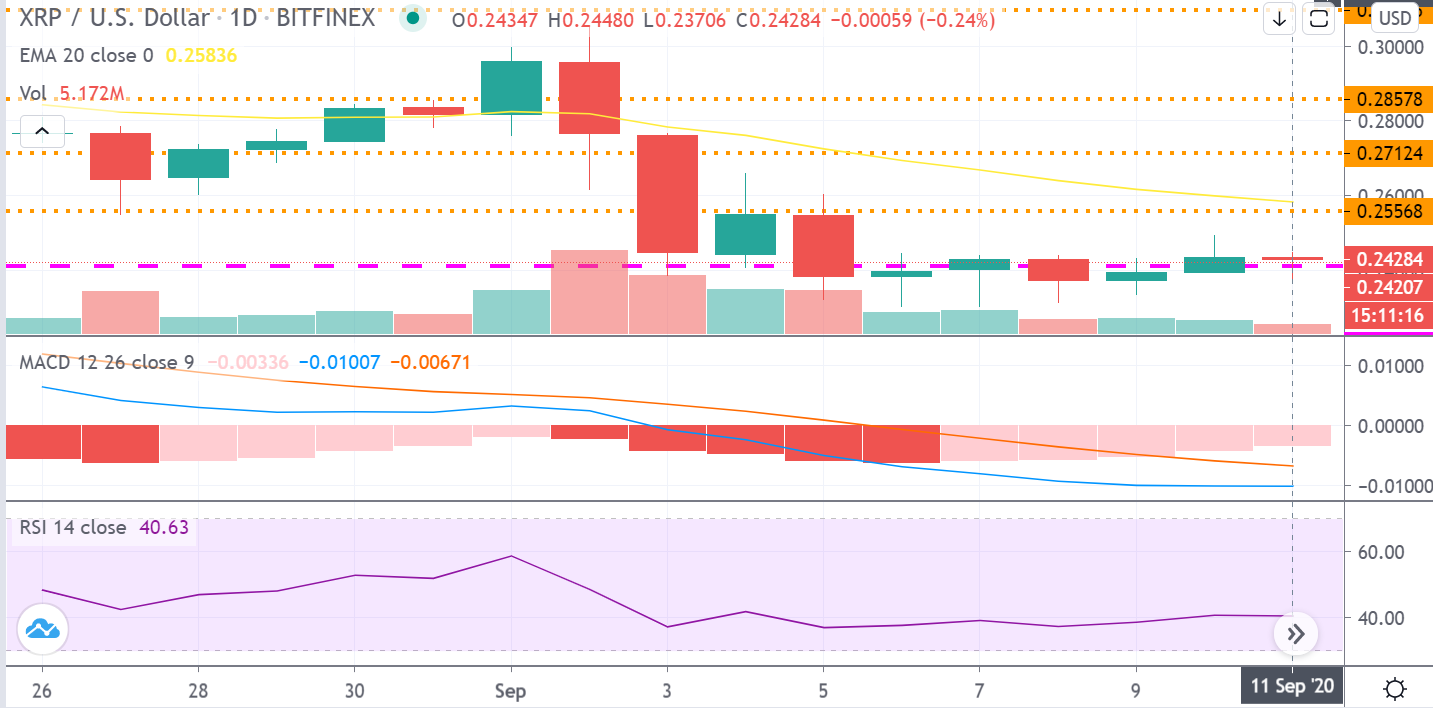
As Ripple still consolidates at the lower support level of the low of 2nd August testing it, again and again, bulls continue to try their best to push the price above it. The bulls have closed the price above $0.241 level which is a positive signal. Ripple made a high just a few points above the crucial lower support of $0.241 at $0.244 and also closed the price above it at $0.242 on Friday, 11th September 2020. The bulls are trying to save the asset from slipping below the lower support out of the Bollinger Bands by buying the low at $0.237 today. More momentum is needed to take the asset towards the $0.255 resistance level.
Key points to mark:
Immediate resistance that XRP is facing = $0.255. If the bulls push XRP above this level, $0.258 (20 EMA) + $0.262 (basis of BB) + $0.271 (50 MA) will be tested, followed by $0.285, before testing $0.302 (upper BB) resistance level.
Immediate support that XRP is facing = $0.241 + $0.223 (lower BB). If the bears push XRP below this level, it will decline below the $0.200 support level.
Indicators
The MACD line is moving further towards negative values below 0, along with the signal line. RSI is still flat at 40.6 out of the overbought region.
LITECOIN / U.S. DOLLAR
Price Analysis
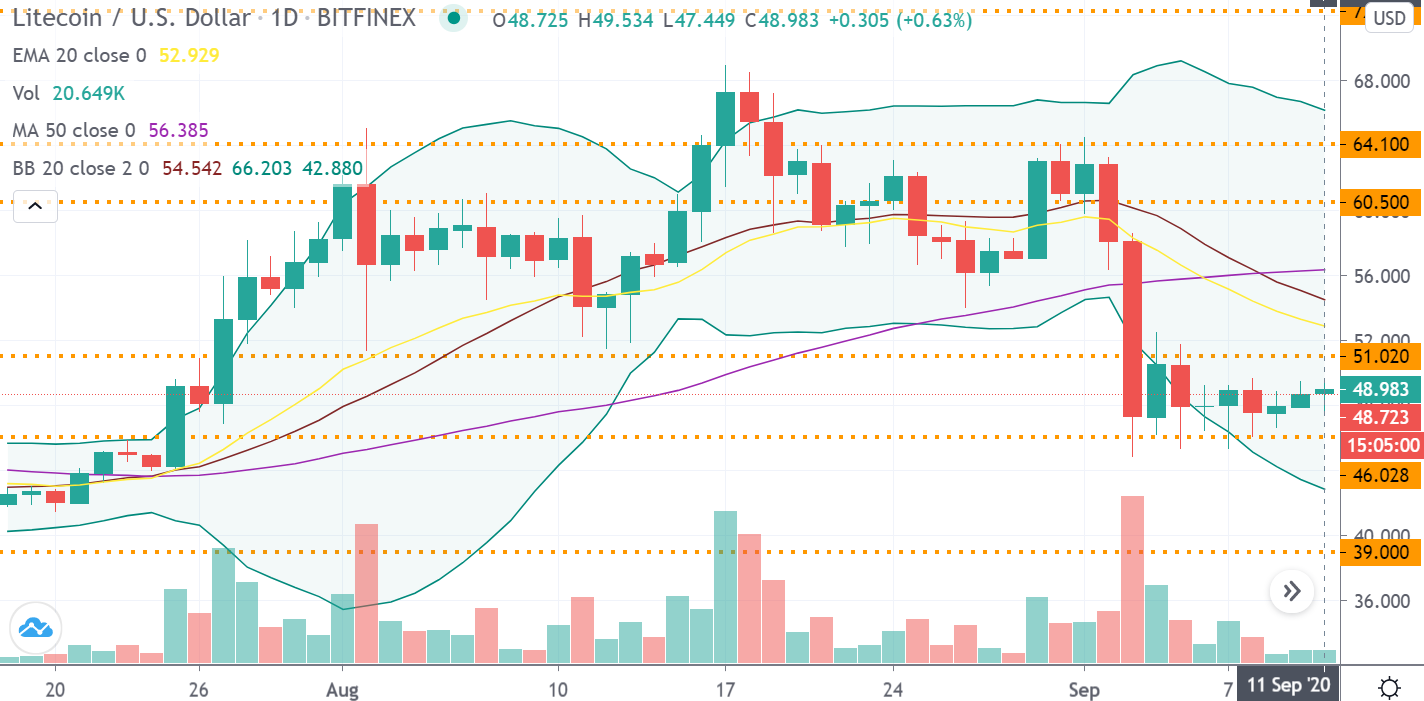
Litecoin is still trading between the $51 and $46 levels. The bulls are trying their best to take the price above the $51 mark but could only take it to a high of $49.5 and closed the price above the $46 level and the lower Bollinger Band at $48.9 on Friday, 11th September 2020. The bulls are not allowing the altcoin to sink below the $46 mark by buying the low at $47. The twenty-day exponential MA and the basis (middle line) of Bollinger Bands including both the bands are significantly sloping down. If bulls use more strength to push Litecoin above the $51 level and maintain the pressure, we can expect XRP to consolidate in the lower Bollinger Band zone for some time. Traders and investors after taking advantage of the lower dips, now wait for this price correction to take an uptrend soon.
Key points to mark:
Immediate resistance that LTC is facing = $51. If the bulls can take the price above this level, LTC will test $52.9 (20 EMA) + $54.5 (basis of BB) + $56 (50 MA), followed by $60.5 and then $64 before testing $66 (upper BB) resistance level.
Immediate support that LTC is facing = $46 + $42.8 (lower BB). If the bears push the price below these levels, LTC will sink to the $39 support level.
Indicators
The MACD line is moving further into the negative zone below 0, along with the signal line. RSI remains flat at 41 out of the overbought zone indicating the bulls are still holding up.

BITCOIN CASH / U.S. DOLLAR
Price Analysis
Bitcoin Cash is still trading between the $246 to $217.5 levels and hasn't been able to cross $235 for a week now, acting as a minor resistance level. The bulls tried to take the price above it, but could only make a high of $228 in the lower half of the Bolinger Bands and closed the price at $225 on Friday, 11th September 2020. The bulls are currently trying their best to save the cryptocurrency from slipping off below the $217.5 mark by buying it back from a low of $220.7 level. Traders and investors, while filling in more at lower levels, watch out carefully for the next move. The 20-day EMA and the basis of Bolinger Bands including both the lower and upper bands are sloping down significantly. If the bulls increase the momentum, this altcoin can go above the $260 level and into the upper half region of Bollinger Bands to witness profitable levels again.

Key points to mark:
Immediate resistance that BCH is facing = $246. If bulls take BCH above these levels, it will face resistance at $248 (20 EMA) + $253 (basis of BB) + $260, followed by $275.8 (50 MA) and then $280.5 before rising to $305.7 (upper BB) + $330 resistance levels.
Immediate support that BCH is facing = $217.5. If bears push BCH below this level, it will test $200.9 (lower BB), and then $200 support below which the price might sink further into lower levels.
Indicators
The MACD line is sloping further away into negative values below 0. The signal line is also moving in negative momentum below 0. RSI remains flattened at 36.8 in the overbought area indicating that bears are trying to take over.