Bitcoin / US Dollar

From the chart above, we see that the bulls continued their momentum of the previous day, resulting in a 0.58% increase in the Bitcoin price on the 1st of February, bringing the asset price to $38,716 per coin. The bullish dominance over the market is seen after the bulls successfully resisted an initial bearish push for market dominance of the day, indicated by the wick below the candle, which denotes the lowest market trading price for the day at $38,021 per coin. With the sustained bullish action on the day, we see the bears resisting further price fall, indicated by the wick above the candle and denotes the highest trading price of Bitcoin for the day at $39,300.
On the 2nd of February, the bulls reignited their momentum of the previous day; however, this was met with significant resistance by the bears, which succeeded in flipping the market in their favor. With the market still far from its close, we expect to see more volatility in the market. Nevertheless, as at the writing of this piece, the Bitcoin price is down by 0.20%, bringing its price to $38,639 per coin, while the highest and lowest trading prices for the day stand at $38,888 and $38,212, respectively.
Despite the volatility in the market, the Bitcoin market still trades below its 50-day moving average of $43,462, maintaining the Bitcoin market in a downtrend.
Indicators

The relative strength index of the Bitcoin market stands below the 50 mark, indicating the dominance of the selling pressure in the market over the bullish buying. However, with the bullish action over the last few days, we see consecutive growth in the relative strength index on the 1st of February to 41.66.
Following a bearish headstart in the market on the 2nd of February. We see the relative strength index fall to 41.35, reflecting increasing bearish action in the market.
The MACD continues its ascent to the zero line; however, it currently trades below this line, portraying a bearish outlook for the market. In correlation to the MACD, the histogram shows growing bullish activity in the market.
Buy and sell BTC on Remitano
Ethereum / US Dollar

The chart shows the bulls keeping up their momentum from the previous day on the 1st of February, following a successful flipping of an initial bearish start to the market. With the bears suppressed, the Ethereum market increased by 3.72%, bringing the ETH price to $2,789 per coin. The wick above the candle reflects bearish resistance to further price growth and denotes the highest ETH trading price for the day at $2,815 per coin, while the lowest trading price for the day stands at $2,675 per coin.
On the 2nd of February, the bears are pushing back the price growth of the previous day, inflicting a 0.22% drop, bringing the Ethereum price to $2,783 per coin. With the market still hours to its close for the day, we expect more volatility; however, the highest and lowest trading prices seen so far stand at $2,805 and $2,742, respectively.
With the values over the last few days, the Ethereum market remains in a downtrend, as indicated by the market=trading below the 50-day moving average of $3,342.
Indicators
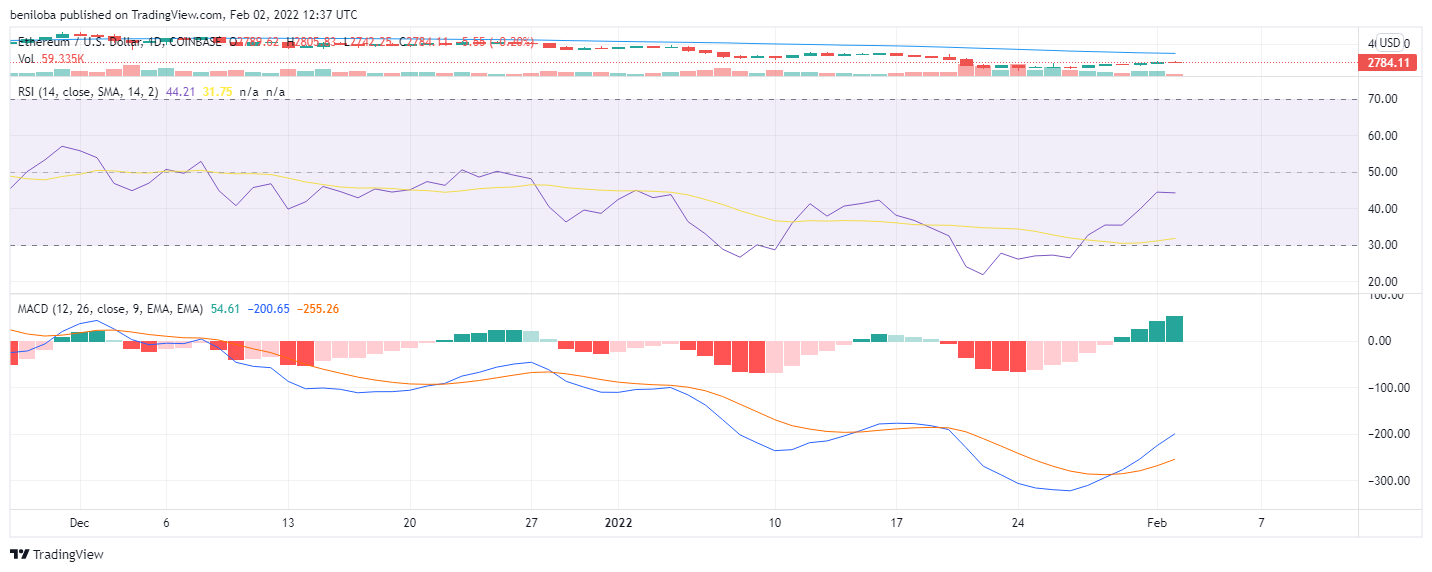
The above chart shows that the Ethereum market experienced a drop in its bullish momentum as the relative strength index deflects to the downside following the bearish action seen on the 2nd of February. On the 1st of February, the relative strength index stands at 44.41, while on the 2nd of February, the relative strength index is down to 44.21, a reflection of the increased selling in the market.
The MACD remains below the zero line, a clear indication of the extended bearish action in the market. In the short term, we see the MACD making an ascent to the zero line, indicating a growing bullish presence in the market, correlating with the histogram, which shows growing bullish entry into the market.
Buy and sell ETH on Remitano
Ripple / US Dollar

On the 1st of February, the Ripple bulls continued their momentum from the previous day, resulting in the Ripple price increasing by 1.71% to $0.627 per coin, while the highest and lowest price points seen in the market stand at $0.631 and $0.611 per coin. Following two days of consecutive bullish action, the 2nd of February sees a bearish pushback, resulting in a 0.08% drop in the XRP price to $0.628 per coin; however, we can see significant bullish resistance to the bearish momentum as indicated by the wick below the candle. We might see the bulls successfully flip the market in their favor with sustained bullish resistance. Nevertheless, the highest and lowest price points seen so far stand at $0.631 and $0.620, respectively.
The Ripple market remains in a downtrend as it trades well below its 50-day moving average of $0.769 per coin.
indicators

As a reflection of the long-term downtrend the Ripple market has been on, we see the relative strength index trade below the 50 mark over an extended period, indicating the dominance of selling against buying in the market. On the 1st and 2nd of February, we see the relative strength index stand at 36.66 and 36.80.
The MACD and histogram show increasing bullish activity in the market; however, over the long term, the MACD shows a market in control by the bears, indicated by the MACD trading below the zero line.
Buy and sell XRP on Remitano
Litecoin / US Dollar
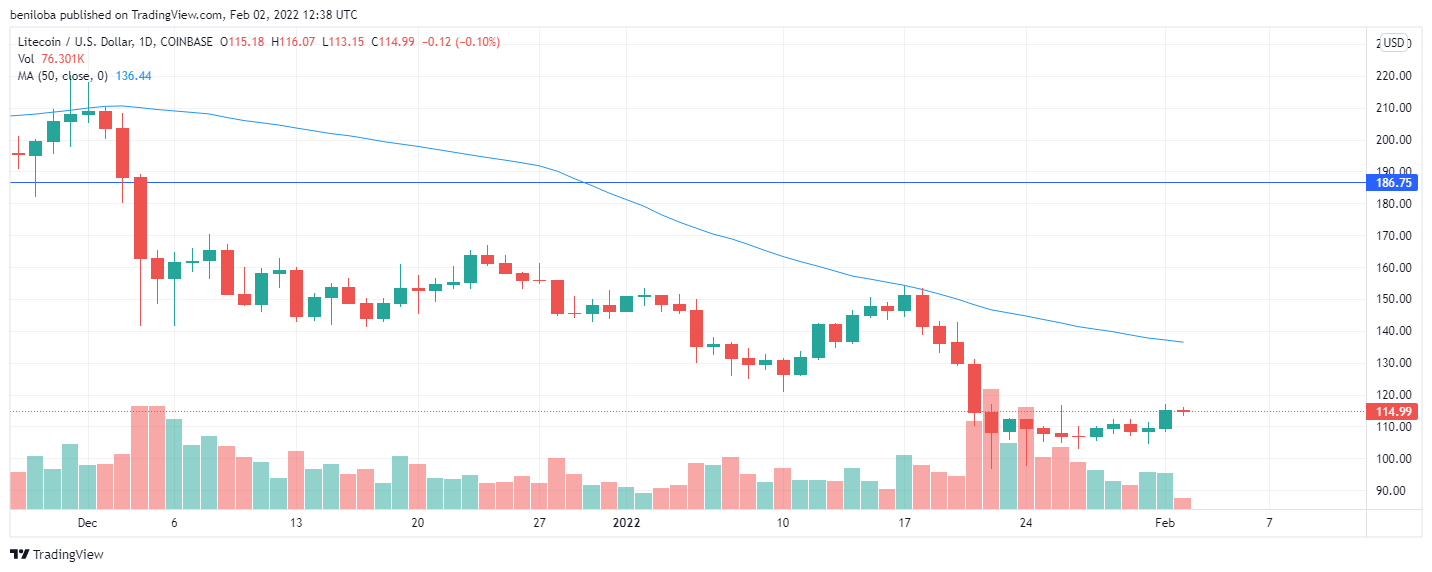
The Litecoin market continues to trade below its 50-day moving average of $136, reflecting a market in a downtrend. On the 1st of February, we see the bulls attempt a positive move towards the 50-day moving average; however, on the 2nd of February, we see the bear's pushback against price growth.
On the 1st of February, the Litecoin market increased by 5.08%, bringing the LTC price to $115 per coin, with the highest and lowest trading prices for the day being $116 and $108, respectively. The pushback initiated on the 2nd of February has resulted in a 0.10% fall in price, bringing the LTC price to $114 per coin, with the highest and lowest price points seen so far at $116 and $113, respectively. With more time left before the close of the day, we expect to see a change in these values.
Indicators

Following consecutive bullish actions over the last few days, the relative strength index on the 1st of February stands at 41, while the budding bearish action on the 2nd of February has resulted in the RSI stalling in its ascent towards the 50 mark, placing the RSI value for the day at 41.14.
In correlation to the relative strength index, we see the MACD deflect to the upside, showing a growing bullish market presence, as agreed upon by the histogram. However, due to the market downtrend over an extended period, the MACD is placed below the zero line, indicating the dominance of the bears over a longer period.
Buy and Sell LTC on Remitano
Bitcoin Cash / US Dollar

As with several other crypto assets, the Bitcoin Cash market remains in a downtrend as it trades below its 50-day moving average of $383 per coin.
From the above chart, we see the bulls begin a move, resulting in a 0.95% rise, bringing the Bitcoin Cash price to $287 per coin, with the highest and lowest price points in the market being $291 and $282, respectively.
Following a successful dominance of the market on the 1st, we see the bulls capitalizing on their previous momentum, increasing the Bitcoin Cash price by 2.64%, translating to $295 per coin. With much time to the close of the day, we expect to see more volatility in the market. Nevertheless, as of the writing of this piece, the highest and lowest trading prices stand at $296 and $286, respectively.
indicators

With the consecutive bullish action over the last two days, the Bitcoin Cash market has broken out of the oversold region ( relative strength index below 30), with a relative strength index on the 1st and 2nd of February being 27and 31. Despite the bullish momentum to bring the market out of an oversold region, the bears remain the dominant force in the market as the relative strength index over the last two days remains below the 50 mark.
In correlation to the RSI, the MACD shows a slight deflection to the upside, indicating growing bullish activity, which is correlated by the histogram. Nevertheless, the overall market remains in bearish control over an extended period, indicated by the MACD standing below the zero line.
Buy and sell BCH on Remitano
Cardano / US Dollar

The ADA market remains in a downtrend as it trades below its 50-day moving average of $1.25. On the 1st of February, the ADA bulls capitalized on a previous momentum, resulting in a 4.19% rise, bringing the ADA price to $1.09 per coin, while the highest and lowest prices for the day stood at $1.09 and $1.03
In response to the massive bullish push of the previous day, we see on the 2nd of February, the bears orchestrating a move, resulting in a 1.53% drop in the ADA price, bringing its value to $1.079 per coin with the highest and lowest trading prices seen so fat being $1.10 and $1.05, respectively.
Indicators
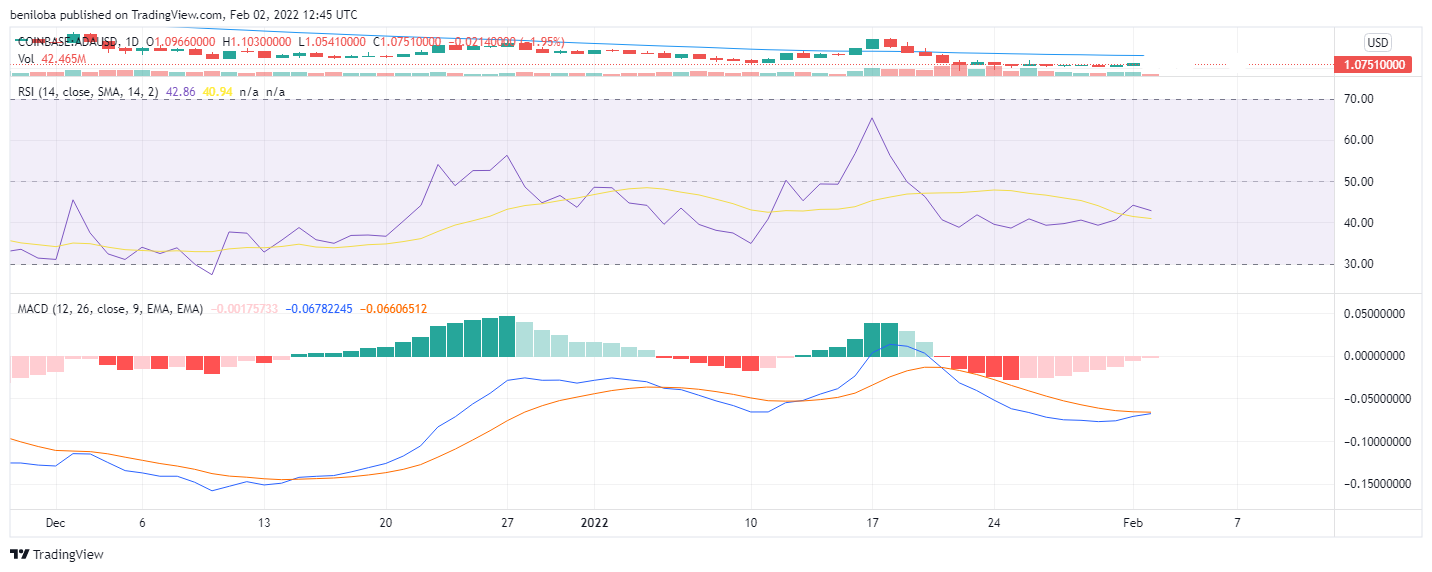
The bullish momentum on the 1st of February increased the relative strength index to 44, while the bearish market dominance on the 2nd of February has resulted in a fall of the relative strength index to 42, reflecting increasing selling pressure in the market.
The MACD is placed below the zero line, indicating bearish dominance over the market. This is correlated by the histogram, which shows bearish action but of reduced intensity, indicating subtle growing bullish activity in the market.
Swap to ADA
Dogecoin / US Dollar

The Dogecoin market is experiencing a third consecutive day of bullish action. On the 1st of February, the bulls initiated a move to gain market dominance which saw the Dogecoin price rise by 0.56% to $0.142 per coin; however, the wick above the candle indicates the bears struggling to restrict the growth of the asset, rejecting it from a daily peak of $0.144, while the lowest price point for the day stood at $0.140 per coin.
At the start of the 2nd of February, the Dogecoin bulls initiated a move to reignite their momentum, resulting in the market growing by 1.68%, translating to a Dogecoin price of $0.144 per coin with the wick above the candle reflecting bearish resistance to further price growth. With more time to the close of the day, we expect to see more volatility in the Dogecoin market. Nevertheless, as at the writing of this piece, the highest and lowest price points stand at $0.146 and $0.141, respectively.
Indicators

With consecutive bullish action, the Dogecoin relative strength index has increased, with the values on the 1st and 2nd of February being 41 and 43, respectively. Despite this price growth, the Dogecoin market remains bearish territory as the RSI value remains below the 50- mark.
In correlation to the relative strength index, the MACD shows a minute deflection to the upside, reflecting the growing bullish action over the last two days; however, with the MACD still below the zero line, the market's dominant force in the market over an extended period remains the bears.
The histogram shows a steady increase in the bullish activity of the market, reflecting more individuals opening positions in the market.
Swap to DOGE
correlations
- Bitcoin / Ethereum = 0.89
- Bitcoin / Ripple = 0.87
- Bitcoin / Litecoin = 0.81
- Bitcoin / Bitcoin cash = 0.83
- Bitcoin / Cardano = 0.77
- Bitcoin / Dogecoin = 0.78
Keynotes for today
- Bitcoin at $38,639 per coin.
- Ethereum at $2,783 per coin.
- Ripple at $0.628 per coin.
- Litecoin at $114 per coin.
- Bitcoin Cash at $295 per coin.
- Cardano at $1.079 per coin.
- Dogecoin at $0.144 per coin.





